Loading [Contrib]/a11y/accessibility-menu.js
Steinbach, S., & Zhuang, X. (2025). Trade Implications of Ending China’s Zero-Covid Policy. Asian Economics Letters, 6(Early View). https:/​/​doi.org/​10.46557/​001c.137226
Download all (5)
  • Figure 1. Event studies
  • Figure 2. Average post-event treatment effects by geographic region
  • Figure 3. Average post-event treatment effects by product group
  • Figure A. Falsification tests for November 2010
  • Figure B. Subtracted linear pre-trends

Abstract

This paper examines the trade implications following the termination of the zero-Covid policy in China. Our event studies indicate a 9.1 percent decline in exports and an 11.5 percent reduc-tion in imports during the first quarter after the policy was revoked. While exports showed a recovery with a 13.2 percent increase in the second quarter, imports continued to be subdued at 7.5 percent. Furthermore, we observe significant heterogeneity in trade response across trading partners, products, and Chinese provinces. Regions that implemented stricter Covid policies experienced more pronounced trade contractions, whereas those that received greater economic support during the pandemic demonstrated a stronger recovery in trade. Our findings under-score the substantial economic disruptions instigated by the Covid pandemic and illustrate the resilience of international trade in the face of the cessation of the zero-Covid policy in China.

I. Introduction

Since the onset of the Covid-19 pandemic, China has implemented stringent policies to restrict disease transmission, including travel limitations, testing requirements, and complete lockdowns of neighborhoods and entire cities (Kirby, 2022). The World Bank estimated that these strict zero-Covid measures reduced gross domestic product growth to 2.7 percent in 2022, the lowest rate in decades (The World Bank, 2022). While most other countries lifted their Covid restrictions in the Spring of 2022, China maintained them until November 2022, significantly impacting the economy and foreign trade (Tianlei, 2022). China’s trade data shows that exports and imports significantly declined during strict Covid measures. In 2022, exports fell by 7 percent compared to pre-pandemic levels, while imports dropped by over 10 percent, highlighting the significant trade disruptions caused by the zero-Covid policy (National Bureau of Statistics of China, 2023).

On November 11, 2022, China’s Joint Prevention and Control Mechanism Team announced the lifting of the inbound flight suspension and revised quarantine measures for incoming foreign travelers. Several Chinese cities, such as Guangzhou and Shanghai, then decided to lift their Covid restrictions despite numerous positive cases. This initiative compelled the Chinese government to abandon the zero-Covid policy, removing the requirement for negative Covid tests for daily activities and travel across regions. The policy shift resulted in a massive Covid outbreak, with some provinces reporting infection rates of almost 90 percent (Burki, 2023; Huang et al., 2023). This reversal had an immediate and measurable impact on China’s trade flows. In the first quarter following the end of the zero-Covid policy, exports fell by 9.1 percent and imports contracted by 11.5 percent. This sharp decline in trade performance correlates directly with the sudden reopening of the economy and subsequent labor shortages due to widespread infections. As restrictions eased further, trade began to recover, with exports rebounding by 13.2 percent in the second quarter, though imports remained suppressed at 7.5 percent.

Before the abrupt termination of the zero-Covid policy in China, public health researchers discussed potential opening strategies and their economic implications. Wu et al. (2023) posited that ending the Covid measures could lead to an economic recession in China, resulting in lost income, increased unemployment, and reduced economic activity. Additionally, a high infection rate among essential workers could disrupt global supply chains in China, adversely impacting the global economy (Cowling, 2023). The literature proposed a sequential opening strategy that could significantly reduce economic losses compared to a nationwide reopening and effectively suppress the peak of Covid-19 cases (Xu et al., 2023). Instead, the Chinese government opted for an abrupt end to the zero-Covid policy, causing considerable disruptions in labor markets and economic activities (May et al., 2023; Strumpf & Lin, 2022). The trade implications of this policy shift were particularly severe for labor-intensive industries such as information and communication technologies (ICT) and food processing. These sectors experienced substantial disruptions due to labor shortages resulting from the rapid rise in Covid infections. However, regions with stronger economic support during the pandemic exhibited faster recovery, particularly in exports, underscoring the varying resilience of different sectors and regions in China.

Despite extensive literature studying the global supply chain disruptions caused by Covid and the policy response (e.g., Ahn & Steinbach, 2023; Bas et al., 2023; Goldberg & Reed, 2023; Ngo & Dang, 2023), little is known about the economic implications of the end of the zero-Covid policy in China and how resilient global supply chains were to this shock. Existing research has explored the macroeconomic consequences of China’s zero-Covid policy. Gong et al. (2024) analyzed the policy’s effects on economic activities, mobility, and environmental issues, while Tang & Zheng (2024) focused on its role in subnational cross-regional export performance. Similarly, Gong et al. (2024) investigated the policy’s impact on labor market outcomes in China, highlighting the risks posed by labor shortages due to high infection rates in key sectors. However, limited research exists on the specific trade impacts following the abrupt end of the policy, which is the focus of this study.

Our paper assesses the response of international trade to the end of the zero-Covid policy in China. We rely on high-frequency trade data and counterfactual statistical methods to study the dynamic trade response. Our event study analysis reveals that China experienced an export decline of 9.1 percent and an import contraction of 11.5 percent in the first quarter after the policy shift. In the second quarter after the policy change, exports rebounded by 13.2 percent, while imports remained depressed at 7.5 percent. Our results also provide evidence of considerable heterogeneity in the trade response across trading partners, products, and Chinese provinces. Labor-intensive industries like information and communication technologies and food processing experienced a larger trade response. Interestingly, there is evidence for distinct patterns of treatment heterogeneity across Chinese regions, with those having stricter Covid policies witnessing larger trade contractions. Simultaneously, Chinese provinces that received substantial economic support during the Covid pandemic saw a more robust trade recovery in the second quarter following the end of the zero-Covid policy. Our findings underscore the considerable trade disruptions caused by the policy shift and highlight the resilience of international trade in the face of global market disruptions due to the end of zero-Covid in China.

II. Data and Methodology

We rely on an event study framework to evaluate the dynamic effects of the termination of China’s zero-Covid policy on foreign trade. Event studies have been commonly employed to examine ex-post treatment dynamics (e.g., Ahn & Steinbach, 2023; Carter et al., 2022; Steinbach, 2022). Leads and lags relative to the event of interest are included to capture pre-trends and assess the post-event treatment dynamics, as described by Freyaldenhoven et al., 2021. A non-linear panel regression model is used to evaluate the treatment dynamics of China’s foreign trade:

\[\small{X_{ij,\ t} = exp\left( \alpha_{ij,yr\ } + \alpha_{ij,mo} + \sum_{m = - 3}^{5}{\beta_{m}r_{ij,t - m}} \right) + \eta_{ij,t}}\tag{1}\]

where \(i\) denotes the Chinese province, \(j\) the foreign trading partner, and \(t\) the month. The outcome of interest is denoted with \(X_{ij,t}\) and maps into the export and import values. We assume that the high-dimensional fixed effects at the province-country-event-year (\(\alpha_{ij,yr}\)) and province-country-event-month (\(\alpha_{ij,mo}\)) levels account for all latent confounders. Among others, potential confounders captured are level differences in the trade outcome and seasonality patterns. The event study is centered around November 2022, when the Chinese government announced the sudden ending of the zero-Covid policy. We measure the dynamic trade response three months before and five months after the event with the term: \(\sum_{m = - 3}^{5}{\beta_{m}r_{ij,t - m}}\). We follow earlier work by Carter et al. (2022) and Steinbach (2023) and use trade flows from 2015 to 2018 to construct a control group unaffected by the policy shift. This approach allows us to account for the cyclic nature of trade flows and obtain a reliable counterfactual for causal inference.

Following standard practice in the related trade literature, we rely on the Poisson pseudo-maximum likelihood estimator to identify the parameters of interest and account for the high-dimensional fixed effects with an iteratively re-weighted least-squares algorithm (Correia et al., 2020; G. Gong & Samaniego, 1981; Silva & Tenreyro, 2006). Because we suspect the standard errors to be correlated at the province-country level, we cluster them this way (Cameron & Miller, 2015). We compiled monthly trade data at the province-country-pair level from the General Administration of Customs of China (2023). The final balanced dataset covers 6,745 province-country pairs at the 2-digit Harmonized System level from January 2010 to April 2023. We used this data to construct the event study panel, which is centered around November 2022. Descriptive statistics are provided in Table A of the Appendix. We aggregate the trade data at the province-country level for the main analysis and use chapter-level trade flows to analyze heterogeneity in the treatment effects according to product characteristics.

III. Results

A. Baseline results

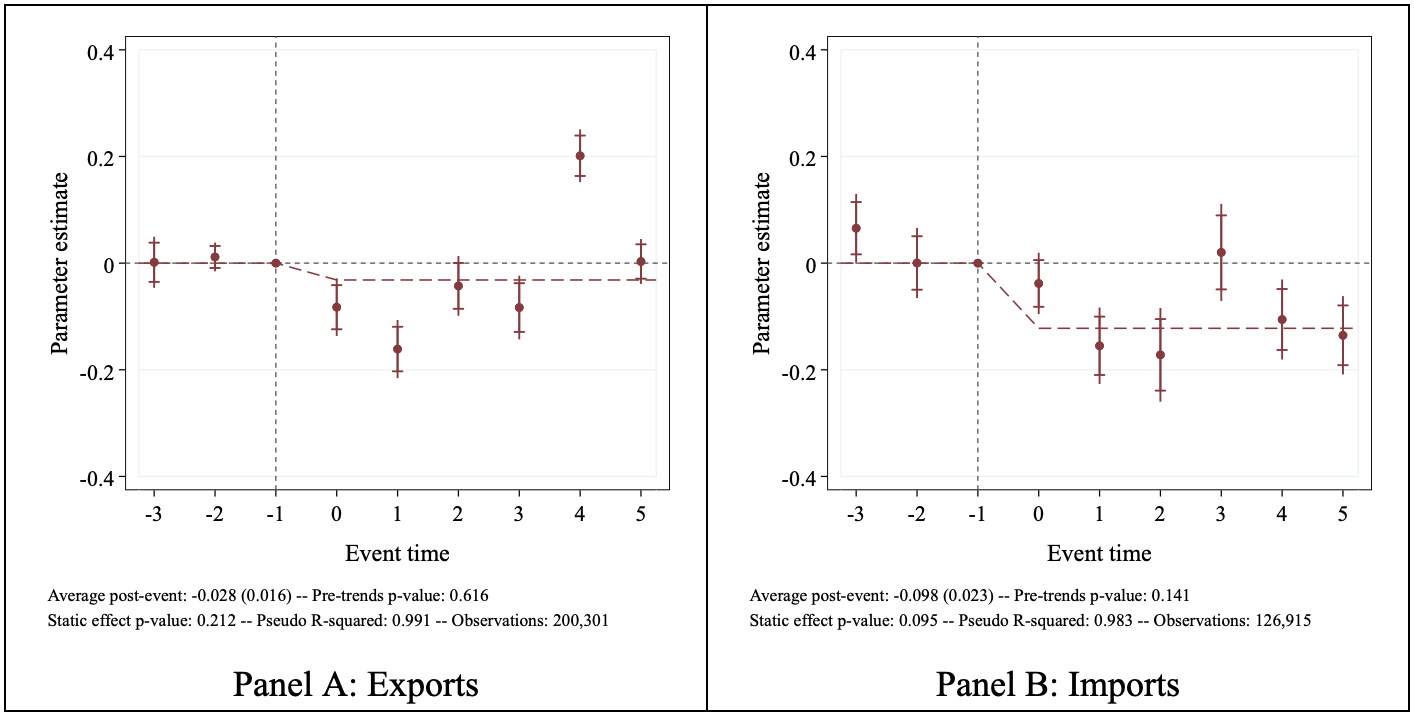
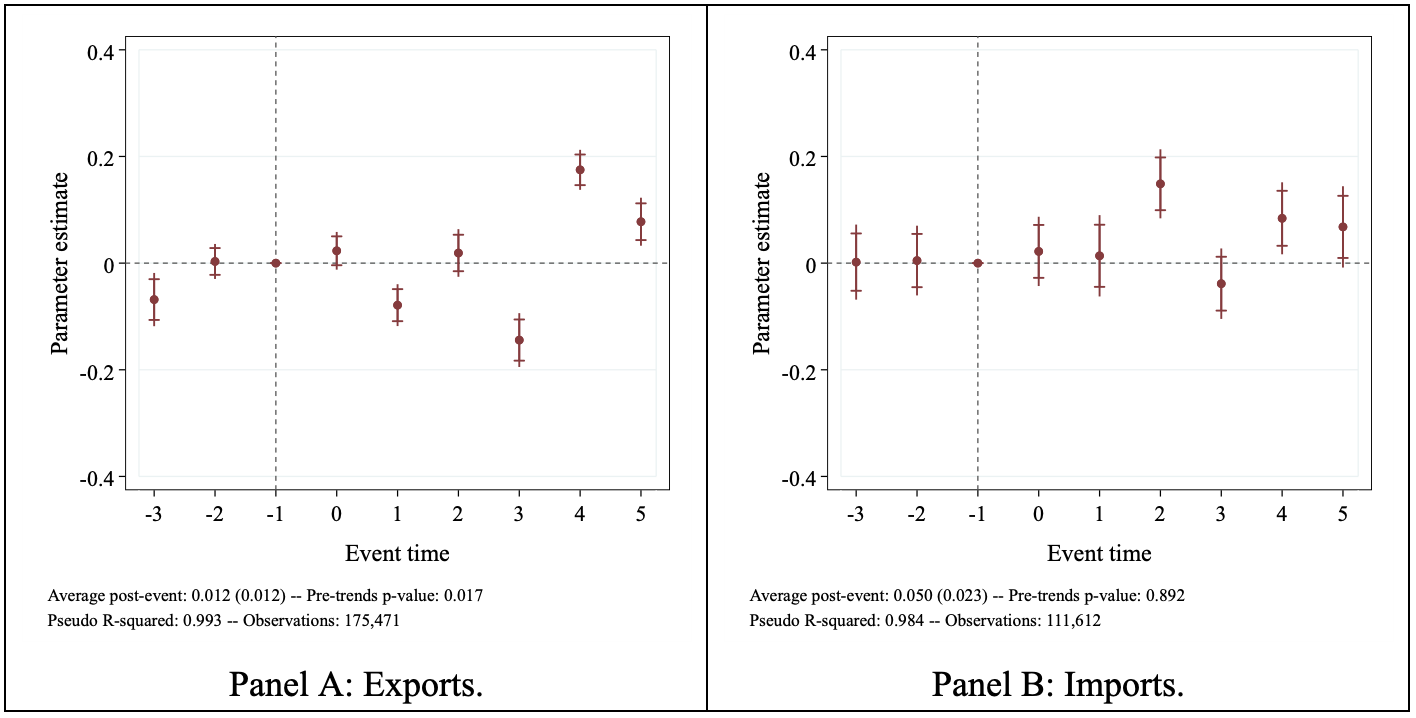
Figure 1 presents event studies analyzing the impact of the conclusion of China’s zero-Covid policy on its foreign trade. Panels A and B display dynamic treatment estimates, 95 percent confidence intervals, and uniform sup-t bands following Montiel Olea and Plagborg-Møller (2019). Additionally, we include static regression model estimates indicated by dashed red lines. Panels A and B also report Wald test statistics for pre-trends and the static effect p-values.

Figure 1
Figure 1.Event studies

Note: The figure shows the dynamic treatment estimates, 95 percent confidence intervals, and uniform sup-t bands for the event-time coefficients. The event time is measured in months relative to the treatment. We centered the event studies around the end of the zero-Covid policy in November 2022. We report average post-event treatment effects, Wald tests for pre-trends, and regression statistics in the figure notes. All regressions include province-country-event-year and province-country-event-month fixed effects. The standard errors are adjusted for within-cluster correlation at the province-country level.

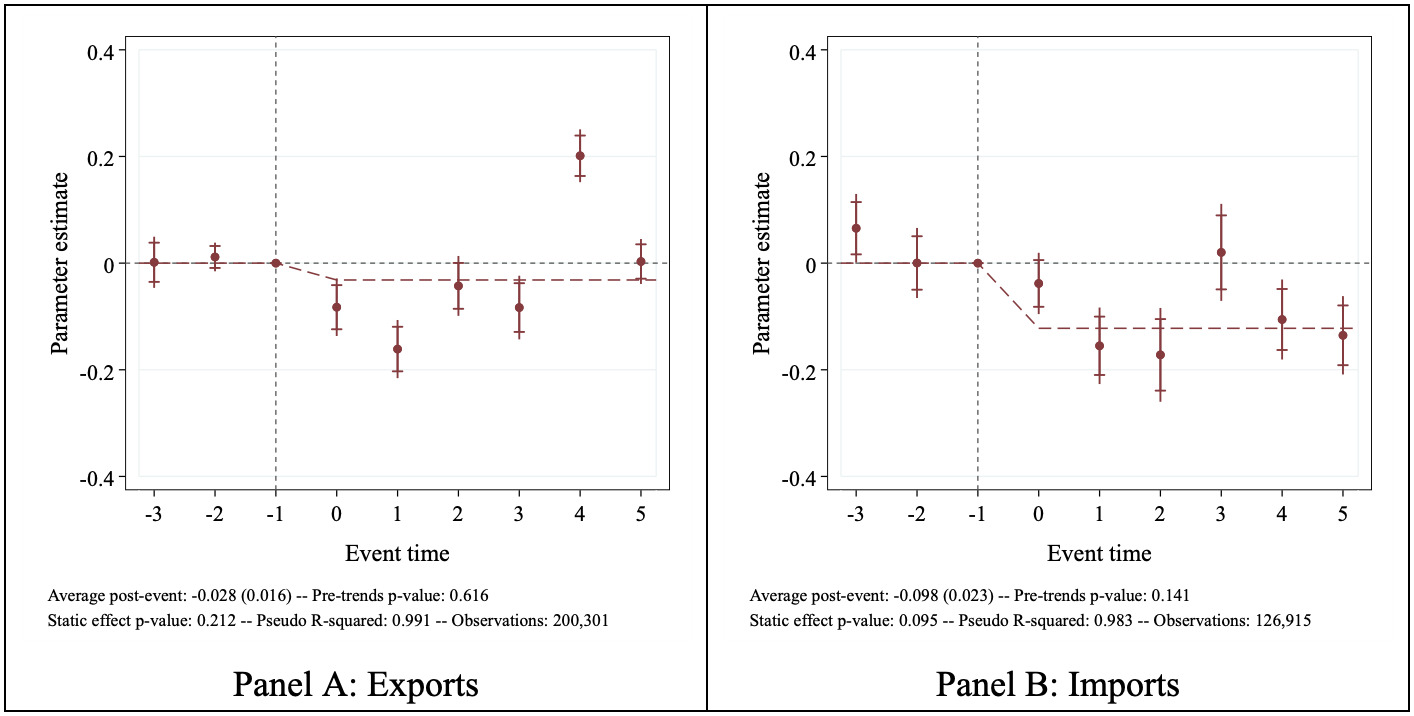
The analysis indicates no significant pre-trends for either outcome, suggesting that the treatment group exhibited trends similar to the control groups during the pre-treatment period when high-dimensional fixed effects were considered, thereby validating the research design (Freyaldenhoven et al., 2019; Sun & Abraham, 2021). In the first quarter following the end of the zero-Covid policy, exports decreased by 9.1 percent, and imports declined by 11.5 percent relative to the counterfactual level.

In the second quarter post-treatment, China’s exports demonstrated a recovery with a 13.2 percent increase, whereas imports remained significantly lower at approximately 7.5 percent. These findings suggest that exporting firms quickly adjusted to the economic disruptions caused by the termination of the zero-Covid policy, while the recovery in imports lagged.

B. Robustness checks

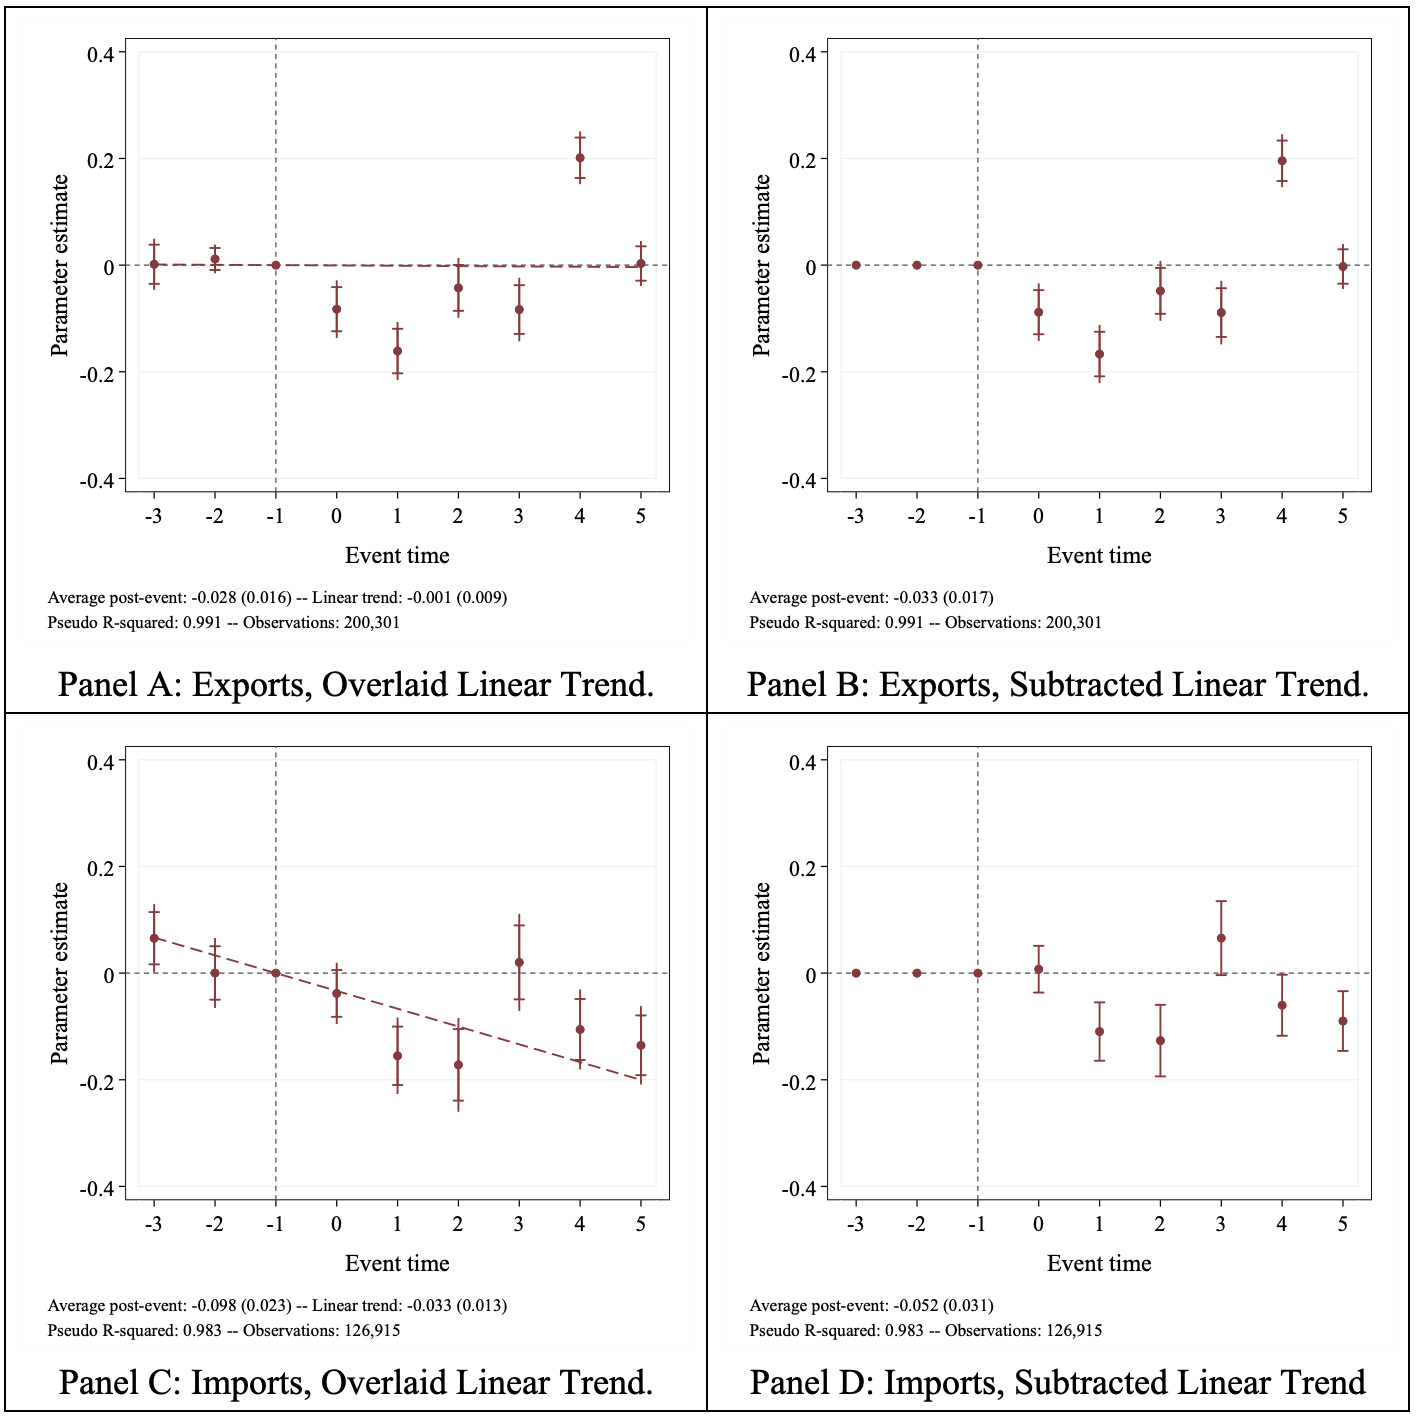
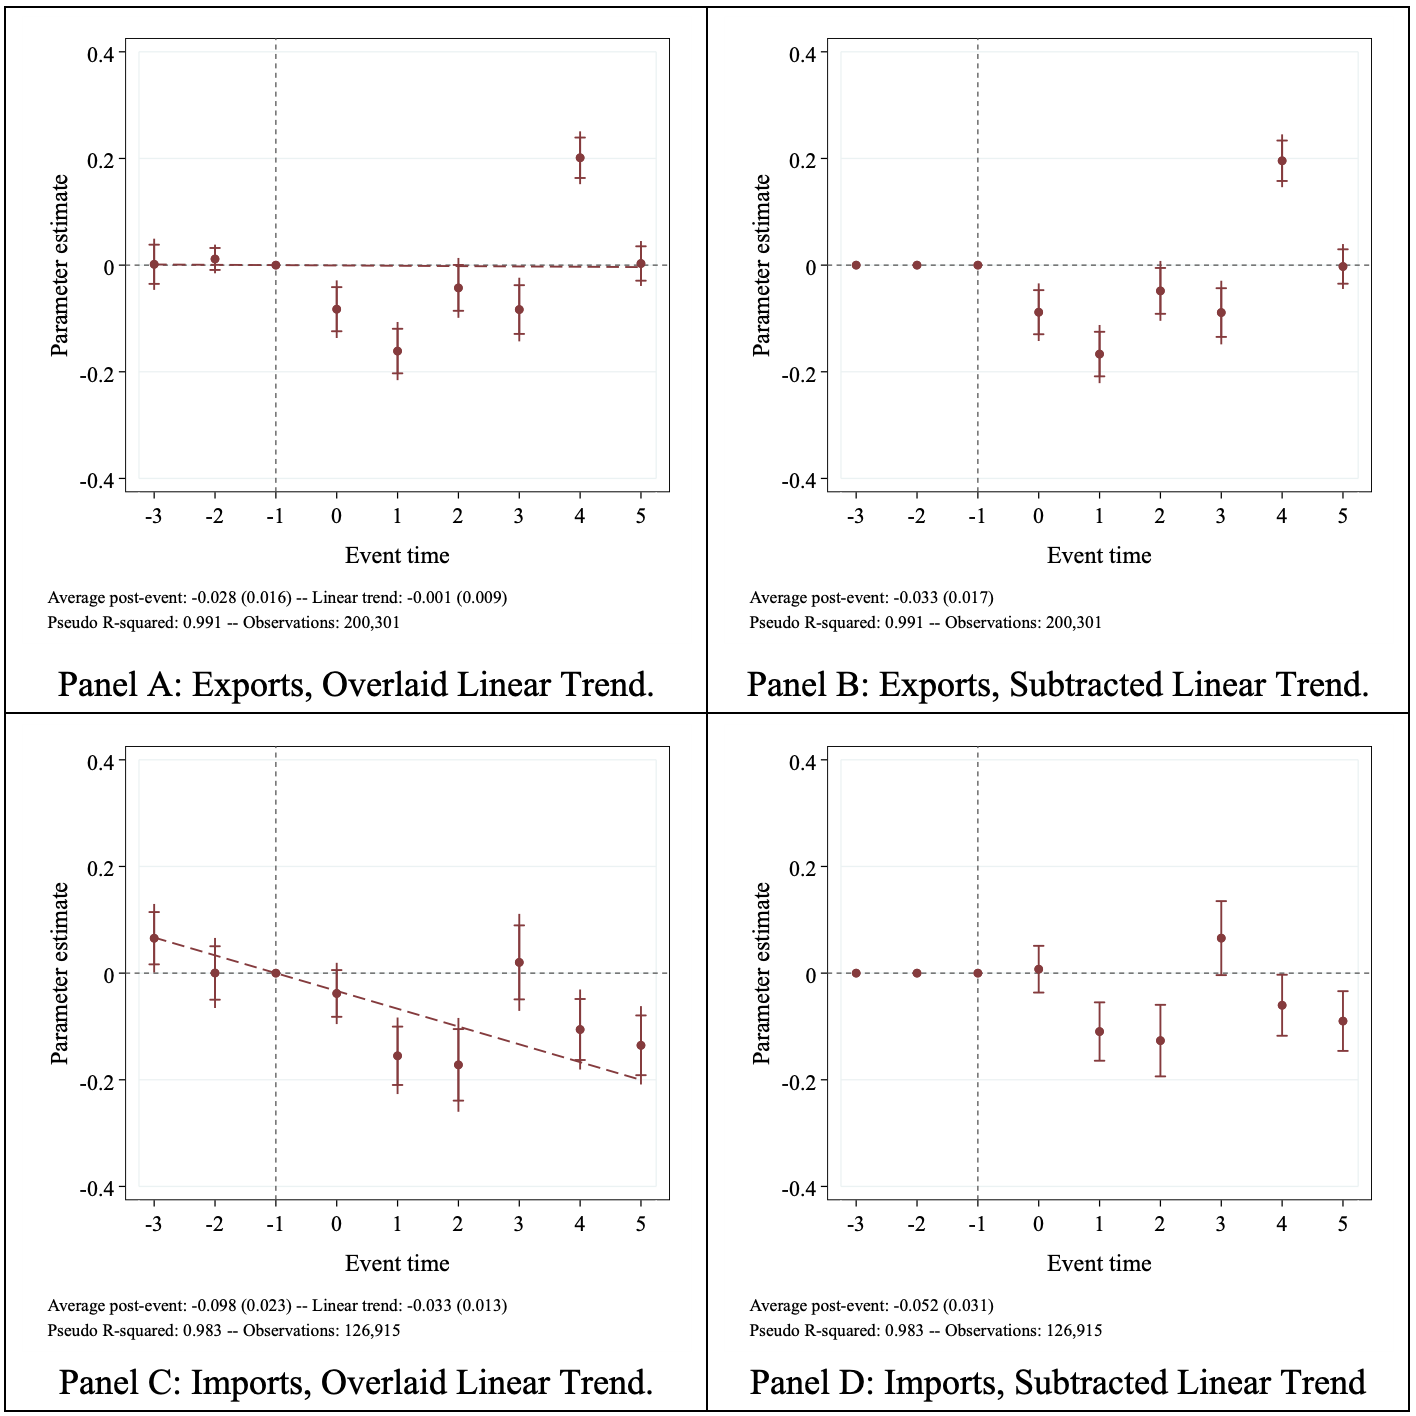
We conducted four robustness checks to ensure the validity of our main results. First, we estimated Equation 1 under an alternative set of fixed effects that absorb less variation in our data. The results of this exercise are shown in the Appendix (see Table B) and indicate no statistically significant differences in the average post-event treatment effects. Second, we compared the estimated treatment effects for three alternative control groups in the Appendix (see Table C). Again, we found limited statistical evidence for significant differences in the estimated dynamic treatment paths. Third, we estimated a placebo model, assigning the treatment to November 2010, which we presented in the Appendix (see Figure A). We found no evidence of a statistically significant relationship between the outcomes and treatment. Lastly, we estimated Equation 1 under the alternative assumption that the treated units would have continued their pre-event paths. We applied the method established by Dobkin et al. (2018) and fitted a deterministic linear trend in event time with a unit-specific slope. We overlaid the estimated linear pre-trends in Panels A and C and presented post-event treatment paths with subtracted linear pre-trends in Panels B and D of Figure B (refer to Appendix). After accounting for linear pre-trends, the estimated average post-treatment effect shifted from a 2.8 percent decrease to a 3.2 percent contraction for exports and from a 9.3 percent drop to a 5.1 percent reduction for imports. It is important to note that the estimates for exports do not differ significantly from each other at conventional levels of statistical significance.

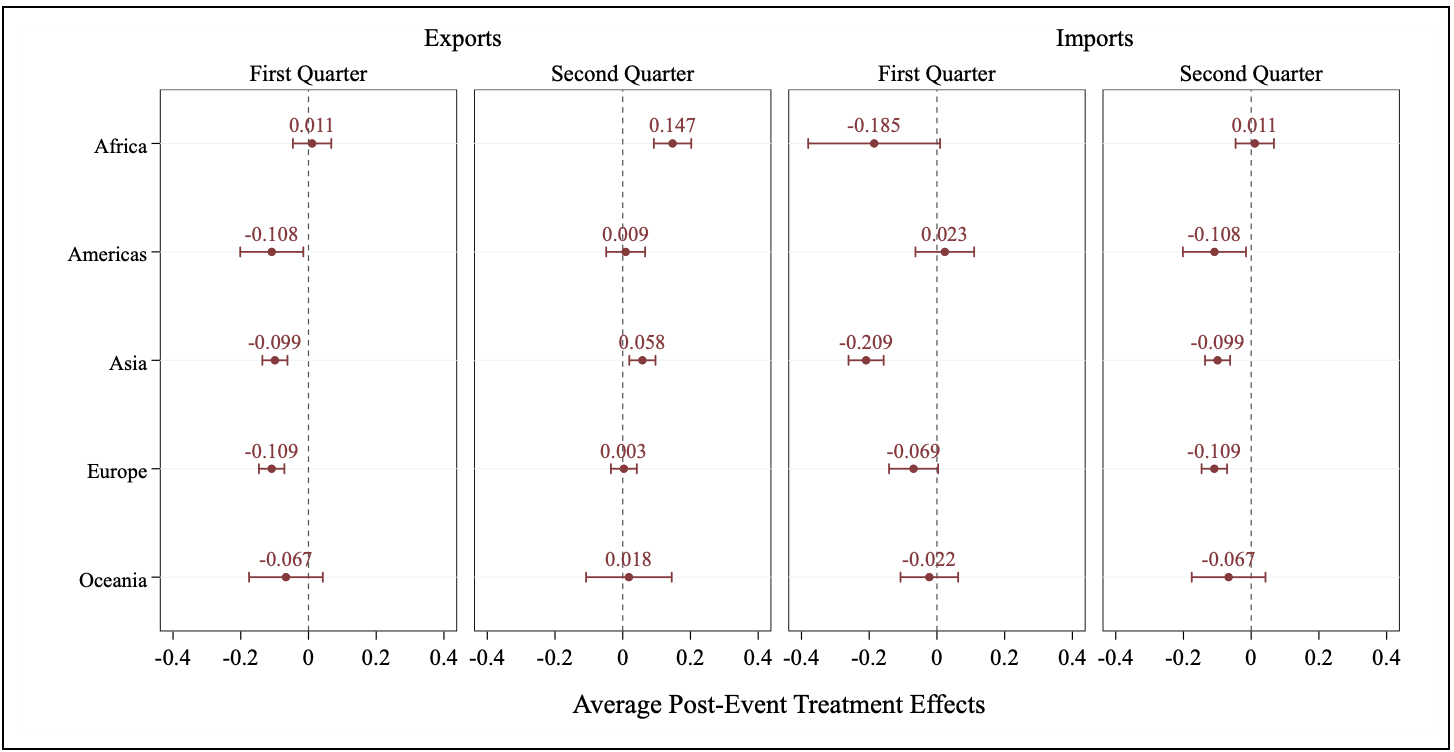
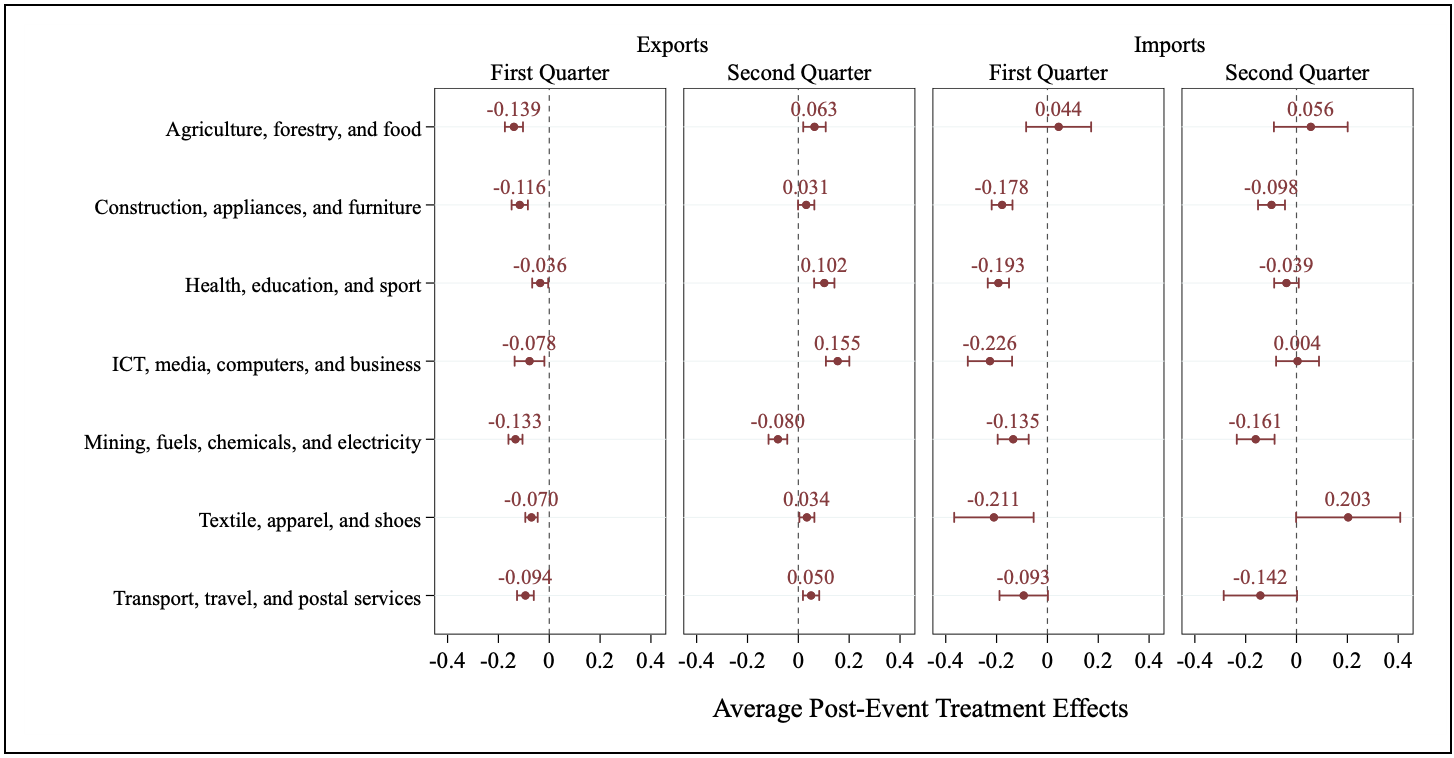
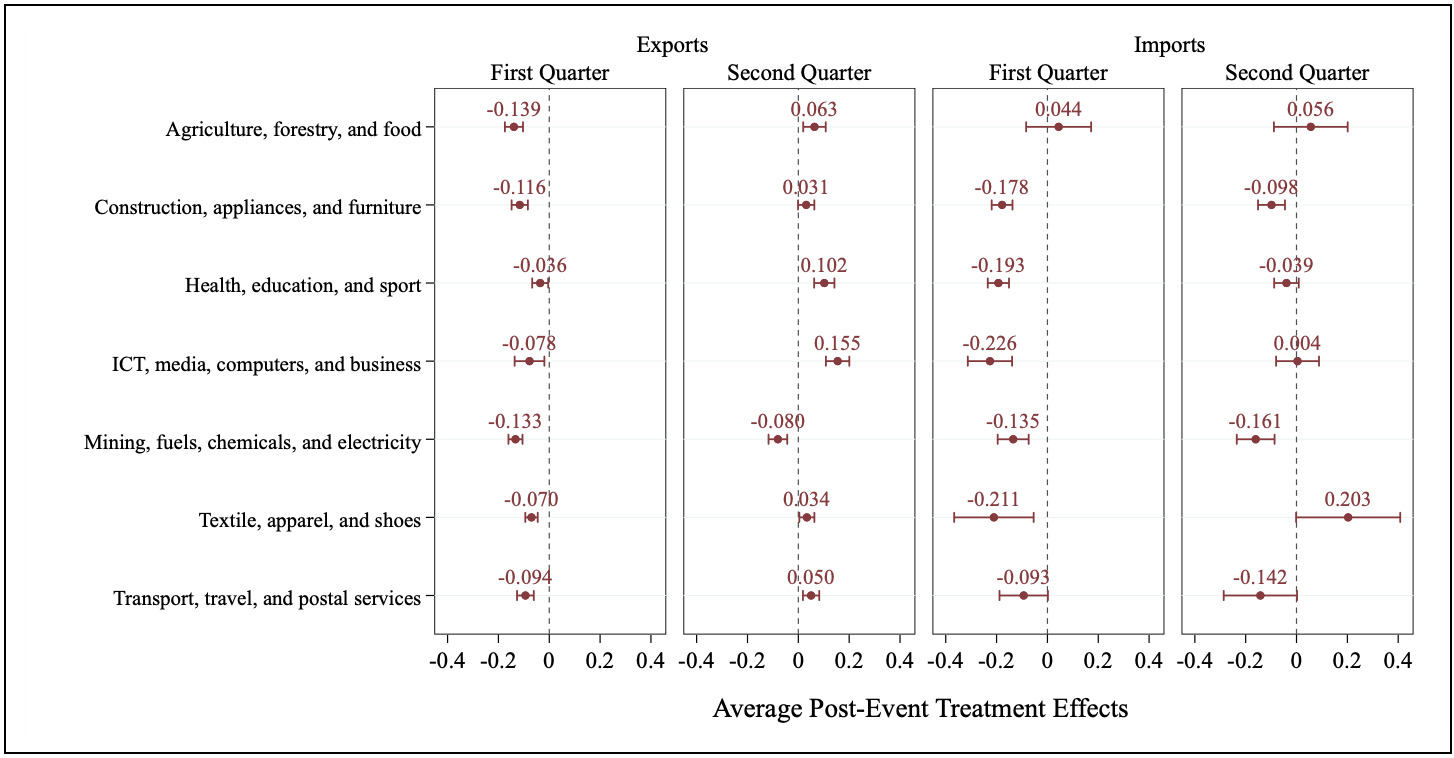
To better understand the mechanisms underlying the observed differences in the post-event treatment paths, we investigated treatment heterogeneity according to the trading partner, product group, and characteristics of Chinese provinces. First, we show estimates by geographic region in Figure 2. The average post-event treatment effects reveal that the initial export shock was similar across export destinations. Interestingly, the recovery was more robust for export destinations in Africa and Asia. In contrast, there is considerable heterogeneity in the import response, with imports from Asian trading partners contracting by 18.9 percent, while those from the Americas were unaffected in the first quarter after the end of the zero-Covid policy. Figure 3 shows that the initial trade shock affected all industries, with agriculture, forestry, and food exports contracting the most, while the recovery was more robust for the information and communication technologies (ICT) industry. In contrast, the evidence for import recovery is much weaker, with mining and fuel imports remaining the most depressed at 14.8 percent in the second quarter. At the same time, textile imports from other Asian countries rebounded strongly, reaching about 22.6 percent above the counterfactual level in the second quarter after the end of the zero-Covid policy. Notably, imports from the Americas were 10.3 percent below the counterfactual in the second quarter after treatment, speaking of the delayed response in shipment cancellation from those countries. Second, we reveal considerable heterogeneity in the trade response according to industry characteristics.

Figure 2
Figure 2.Average post-event treatment effects by geographic region

Note: The figure shows the average post-event treatment effects and corresponding 95 percent confidence intervals for the first and second quarters after treatment by geographic region to which China’s trading partners belong. The first quarter spans November 2022 to January 2023, and the second quarter covers February to April 2023. The average post-event treatment effects are calculated following de Chaisemartin & D’Haultfoeuille (2022). All regressions include province-country-event-year and province-country-event-month fixed effects. The standard errors are adjusted for within-cluster correlation at the province-country level.

Figure 3
Figure 3.Average post-event treatment effects by product group

Note: The figure shows the average post-event treatment effects and corresponding 95 percent confidence intervals for the first and second quarters after treatment by product group. The first quarter spans November 2022 to January 2023, and the second quarter covers February to April 2023. Products were classified using the Broad Economic Categories (United Nations, 2023). We followed de Chaisemartin & D’Haultfoeuille (2022) to calculate the average post-event treatment effects. All regressions include province-country-event- year and province-country-event-month fixed effects. The standard errors are adjusted for within-cluster correlation at the province-country level.

We now turn to heterogeneity in the trade response according to province characteristics in Table 1. Panel A shows that Chinese provinces that implemented stricter Covid policies saw a more considerable reduction in exports in the first quarter after the end of the zero-Covid policy. At the same time, there is little evidence for treatment heterogeneity in the import response. A similar pattern exists for provinces with a free trade zone, as shown in Panel B. Exports from those contracted by 10.2 percent, while they expanded above the counterfactual level in provinces without a free trade zone. Again, there is little evidence of treatment heterogeneity in the import response. Panel C corroborates these findings, indicating that more populated areas saw a more substantial initial export decline and a weaker recovery in the second quarter after the zero-Covid policy. Lastly, looking at the economic support received by the Chinese provinces during the Covid pandemic, we find that exports from those provinces with the strongest economic backing contracted by about 11.7 percent but recovered faster than those from other provinces. Again, there is little evidence for treatment heterogeneity on the import side.

Table 1.Province-level differences in the post-event treatment effects
Exports Imports
First Quarter Second Quarter First Quarter Second Quarter
Panel A: Stringency Level
Low -0.060*** 0.038** -0.143*** -0.080***
(0.016) (0.017) (0.027) (0.027)
High -0.112*** 0.041** -0.111*** -0.071*
(0.024) (0.018) (0.029) (0.037)
Panel B: Free Trade Zone
Non-FTZ 0.160*** 0.160*** -0.136*** -0.041
(0.028) (0.022) (0.047) (0.031)
FTZ -0.107*** -0.033*** -0.121*** 0.006
(0.020) (0.008) (0.023) (0.012)
Panel C: Population Density
Low 0.028 0.12*** -0.104*** -0.034
(0.022) (0.023) (0.034) (0.034)
High -0.136*** 0.014 -0.126*** -0.084***
(0.021) (0.016) (0.025) (0.032)
Panel D: Economic Support
Low -0.077*** 0.026 -0.119*** -0.080***
(0.013) (0.017) (0.027) (0.034)
High -0.124*** 0.065*** -0.129*** -0.056*
(0.034) (0.023) (0.031) (0.033)
Observations 200,301 200,301 126,915 126,915
Pseudo R-squared 0.991 0.991 0.983 0.983

Note: The table shows the average post-event treatment effects for the first and second quarters after treatment. We compare differences according to province characteristics. Data for the stringency level and economic support come from the Oxford COVID-19 Government Response Tracker (Hale et al., 2021) and data for the population density and free trade zone are from the National Bureau of Statistics of China (2023) and the China Free Trade Zone Service Network (2023). We followed de Chaisemartin & D’Haultfoeuille (2022) to calculate the average post-event treatment effects. All regressions include province-country-event-year and province-country-event-month fixed effects. The standard errors are adjusted for within-cluster correlation at the province-country level. ***, **, and * indicate statistical significance at the 1 percent, 5 percent, and 10 percent confidence levels, respectively.

IV. Conclusion

This paper examines the trade response to the end of the zero-Covid policy in China, utilizing high-frequency trade data, counterfactual statistical techniques, and event study methods. Following the end of the Covid restrictions, China experienced a significant contraction in foreign trade, with exports declining by 9.1 percent and imports dropping by 11.5 percent below the counterfactual level in the first quarter after the policy shift. Notably, the trade recovery was stronger for exports compared to imports. In the second quarter after the policy change, China’s exports rebounded by 13.2 percent, while imports remained depressed at 7.5 percent. Our heterogeneity analysis revealed distinct patterns of treatment variation across export destinations and industries. For instance, labor-intensive industries, such as ICT and food processing, experienced larger adverse trade effects. Interestingly, Chinese provinces exhibit distinct patterns of treatment heterogeneity, as provinces with stricter Covid policies witnessed larger trade contractions. Concurrently, those provinces that received substantial economic support during the Covid pandemic saw a more robust export recovery in the second quarter following the end of the zero-Covid policy. These findings underscore the significance of trade disruptions caused by the policy shift and highlight the resilience of international trade in the face of market disruptions resulting from the end of zero-Covid in China.

To mitigate trade disruptions caused by abrupt policy changes like the end of the zero-Covid policy, a phased reopening with targeted support for labor-intensive sectors could have reduced supply chain shocks. Strong institutional frameworks, including effective legal enforcement, play a key role in ensuring business continuity. Governance, transparency, and adherence to the rule of law are essential in fostering resilience in international trade, particularly during crises. Additional research is required to identify the policy measures that could improve global supply chain resilience.

Accepted: February 04, 2025 AEST

References

Ahn, S., & Steinbach, S. (2023). The impact of covid-19 trade measures on agricultural and food trade. Applied Economic Perspectives and Policy, 45(2), 911–927. https:/​/​doi.org/​10.1002/​aepp.13286
Google ScholarPubMed CentralPubMed
Bas, M., Fernandes, A., & Paunov, C. (2023). How Resilient Was Trade to COVID-19? Economics Letters, 240, 111080. https:/​/​doi.org/​10.1016/​j.econlet.2023.111080
Google ScholarPubMed CentralPubMed
Burki, T. (2023). Moving Away from Zero COVID in China. The Lancet Respiratory Medicine, 11(2), 132. https:/​/​doi.org/​10.1016/​S2213-2600(22)00508-2
Google ScholarPubMed CentralPubMed
Cameron, A. C., & Miller, D. L. (2015). A practitioner’s guide to cluster-robust inference. Journal of Human Resources, 50(2), 317–372. https:/​/​doi.org/​10.3368/​jhr.50.2.317
Google Scholar
Carter, C. A., Steinbach, S., & Zhuang, X. (2022). Global shipping container disruptions and US agricultural exports. Journal of Transport Economics and Policy. Accepted.
Google Scholar
China Free Trade Zone Service Network. (2023). China free trade zone. China Free Trade Zone Service Network. http:/​/​fta.mofcom.gov.cn
Correia, S., Guimarães, P., & Zylkin, T. (2020). Fast Poisson estimation with high-dimensional fixed effects. The Stata Journal, 20(1), 95–115. https:/​/​doi.org/​10.1177/​1536867X20909691
Google Scholar
Cowling, B. (2023). The impact of ending ‘zero COVID’ in China. Nature Medicine, 29(2), 302–302. https:/​/​doi.org/​10.1038/​d41591-023-00001-1
Google Scholar
de Chaisemartin, C., & D’Haultfoeuille, X. (2022). Difference-in-differences estimators of intertemporal treatment effects (Working Paper No. 29873). National Bureau of Economic Research. https:/​/​doi.org/​10.3386/​w29873
Dobkin, C., Finkelstein, A., Kluender, R., & Notowidigdo, M. J. (2018). The economic consequences of hospital admissions. American Economic Review, 108(2), 308–352. https:/​/​doi.org/​10.1257/​aer.20161038
Google ScholarPubMed CentralPubMed
Freyaldenhoven, S., Hansen, C., Pérez, J. P., & Shapiro, J. M. (2021). Visualization, identification, and estimation in the linear panel event-study design (No. w29170). National Bureau of Economic Research.
Freyaldenhoven, S., Hansen, C., & Shapiro, J. M. (2019). Pre-event trends in the panel event-study design. American Economic Review, 109(9), 3307–3338. https:/​/​doi.org/​10.1257/​aer.20180609
Google Scholar
General Administration of Customs of China. (2023). Imports and exports. General Administration of Customs of China. https:/​/​customs.gov.cn/​statistics/​
Goldberg, P. K., & Reed, T. (2023). Is the global economy deglobalizing? If so, why? And what is next? Brookings Papers on Economic Activity, 2023(1), 347–423. https:/​/​doi.org/​10.1353/​eca.2023.a919362
Google Scholar
Gong, D., Shang, Z., Su, Y., Yan, A., & Zhang, Q. (2024). Economic impacts of China’s zero-COVID policies. China Economic Review, 83, 102101. https:/​/​doi.org/​10.1016/​j.chieco.2023.102101
Google Scholar
Gong, D., Yan, A., & Yu, J. (2024). The costs of zero-covid: Effects of anti-contagious policy on labor market outcomes in China. Journal of Labor Research, 45(3), 436–478. https:/​/​doi.org/​10.1007/​s12122-024-09360-1
Google Scholar
Gong, G., & Samaniego, F. J. (1981). Pseudo maximum likelihood estimation: theory and applications. The Annals of Statistics, 861–869. https:/​/​doi.org/​10.1214/​aos/​1176345526
Google Scholar
Hale, T., Angrist, N., Goldszmidt, R., Kira, B., Petherick, A., Phillips, T., Webster, S., Cameron-Blake, E., Hallas, L., Majumdar, S., & Tatlow, H. (2021). A global panel database of pan-demic policies (Oxford COVID-19 Government Response Tracker). Nature Human Behaviour, 5(4), 529–538. https:/​/​doi.org/​10.1038/​s41562-021-01079-8
Google Scholar
Huang, S., Gao, Z., & Wang, S. (2023). China’s COVID-19 reopening measures—warriors and weapons. The Lancet, 401(10377), 643–644. https:/​/​doi.org/​10.1016/​S0140-6736(23)00213-1
Google ScholarPubMed CentralPubMed
Kirby, W. C. (2022). Zeroing out on zero-COVID. Science, 376(6597), 1026–1026.
Google Scholar
May, B., McFee, I., Sweet, R., Loo, L., Nobile, N., Yamaguchi, N., Goodwin, A., & Senussi, M. (2023). World economic prospects monthly—global. Economic Outlook, 47, 1–30. https:/​/​doi.org/​10.1111/​1468-0319.12727
Google Scholar
Montiel Olea, J. L., & Plagborg-Møller, M. (2019). Simultaneous confidence bands: Theory, implementation, and an application to SVARs. Journal of Applied Econometrics, 34(1), 1–17. https:/​/​doi.org/​10.1002/​jae.2656
Google Scholar
National Bureau of Statistics of China. (2023). National data. National Bureau of Statistics of China. https:/​/​data.stats.gov.cn
Ngo, C. N., & Dang, H. (2023). Covid-19 in America: Global supply chain reconsidered. The World Economy, 46(1), 256–275. https:/​/​doi.org/​10.1111/​twec.13317
Google ScholarPubMed CentralPubMed
Silva, J. S., & Tenreyro, S. (2006). The log of gravity. The Review of Economics and Statistics, 641–658. https:/​/​doi.org/​10.1162/​rest.88.4.641
Google Scholar
Steinbach, S. (2022). Port congestion, container shortages, and US foreign trade. Economics Let-Ters, 213, 110392. https:/​/​doi.org/​10.1016/​j.econlet.2022.110392
Google Scholar
Steinbach, S. (2023). The Russia–Ukraine war and global trade reallocations. Economics Letters, 226, 111075. https:/​/​doi.org/​10.1016/​j.econlet.2023.111075
Google Scholar
Strumpf, D., & Lin, L. (2022). Chinese factories, restaurants adjust to life without zero-Covid. The Wall Street Journal. https:/​/​www.wsj.com/​articles/​chinese-factories-restaurants-adjust-to-life-without-zero-covid-11672577001
Sun, L., & Abraham, S. (2021). Estimating dynamic treatment effects in event studies with heterogeneous treatment effects. Journal of Econometrics, 225(2), 175–199. https:/​/​doi.org/​10.1016/​j.jeconom.2020.09.006
Google Scholar
Tang, H., & Zheng, X. (2024). How did China’s zero Covid policy affect its exports? Review of International Economics, 32(2), 545–573. https:/​/​doi.org/​10.1111/​roie.12696
Google Scholar
The World Bank. (2022). China economic update – December 2022. The World Bank Publication. https:/​/​doi.org/​10.1596/​37530
Tianlei, H. (2022). China’s zero-COVID policies are crippling its economic outlook. Peterson Institute for International Economics. https:/​/​www.piie.com/​blogs/​realtime-economic-issues-watch/​chinas-zero-covid-policies-are-crippling-its-economic-outlook
United Nations. (2023). Classification by Broad Economic Categories Rev.5. United Nations Trade Statistics Branch. https:/​/​unstats.un.org/​unsd/​trade/​classifications/​bec.asp
Wu, S., Huang, Z., Grant-Muller, S., Gu, D., & Yang, L. (2023). Modelling the reopen strategy from dynamic zero-COVID in China considering the sequela and reinfection. Scientific Re-Ports, 13(1), 7343. https:/​/​doi.org/​10.1038/​s41598-023-34207-7
Google ScholarPubMed CentralPubMed
Xu, C., Wang, X., Hu, H., Qin, H., Wang, J., Shi, J., & Hu, Y. (2023). A sequential re-opening of provinces for China’s zero-COVID policy. Nature Medicine, 29(12), 2977–2978. https:/​/​doi.org/​10.1038/​s41591-022-02177-4
Google Scholar

Appendix

Table A.Descriptive statistics
Mean Std. Dev. Min. Max. Obs. Sum
Panel A: Exports
Exports (Pre) 3,793 19,910 0 860,565 15,643 59,341,153
Exports (Post, first quarter) 3,693 17,913 0 624,885 15,695 57,964,584
Exports (Post, second quarter) 3,546 18,214 0 780,869 15,405 54,630,112
Panel B: Imports
Imports (Pre) 4,561 19,584 0 352,084 9,728 44,365,320
Imports (Post, first quarter) 4,403 18,520 0 329,641 9,757 42,960,631
Imports (Post, second quarter) 4,300 18,042 0 377,160 9,855 42,379,100

Note. The table presents descriptive statistics for exports and imports. The pre-event period includes trade data from August to October 2022. The post-event period is divided into the first and second quarters after treatment. The first quarter includes November 2022 to January 2023, and the second quarter covers February 2023 to April 2023. All trade values are scaled in millions of current USD.

Table B.Average post-event treatment effects with different fixed effects
Exports Imports
First Quarter Second Quarter First Quarter Second Quarter
Panel A: province-country-year, province-country-month fixed effects
Average Post-Event Effect -0.095*** 0.04*** -0.122*** -0.074***
(0.02) (0.015) (0.023) (0.028)
Observations 200,301 200,301 126,915 126,915
Pseudo R-squared 0.991 0.991 0.983 0.983
Panel B: province-year, province-month, country-year, country-month fixed effects
Average Post-Event Effect -0.095*** 0.041*** -0.118*** -0.07***
(0.020) (0.015) (0.022) (0.027)
Observations 242,348 242,348 196,894 196,894
Pseudo R-squared 0.943 0.943 0.842 0.842

Note: The table shows the average post-event treatment effects for the first and second quarters after treatment. The post-event treatment effects were calculated following de Chaisemartin & D’Haultfoeuille (2022). We included province-country-event-year and province-country-event-month fixed effects in panel (a) and province-event-year, country-event-year, province-event-month, and country-event-month fixed effects in panel (b). The standard errors are adjusted for within-cluster correlation at the province-country level. ***, **, and * indicate statistical significance at the 1 percent, 5 percent, and 10 percent confidence levels, respectively.

Table C.Average post-event treatment effects for different control groups
Exports Imports
First Quarter Second Quarter First Quarter Second Quarter
Panel A: 2015 to 2018
Average Post-Event Effect -0.095*** 0.040*** -0.122*** -0.074***
(0.020) (0.015) (0.023) (0.028)
Observations 200,301 126,915
Pseudo R-squared 0.991 0.983
Panel B: 2010 to 2018
Average Post-Event Effect -0.088*** 0.074*** -0.104*** -0.072**
(0.017) (0.013) (0.022) (0.030)
Observations 372,621 252,142
Pseudo R-squared 0.984 0.972
Panel C: 2015 to 2022
Average Post-Event Effect -0.094*** 0.042*** -0.090*** -0.040
(0.020) (0.015) (0.020) (0.025)
Observations 417,218 274,054
Pseudo R-squared 0.989 0.977
Panel D: 2016 to 2022
Average Post-Event Effect -0.101*** 0.026* -0.091*** -0.050**
(0.020) (0.016) (0.020) (0.026)
Observations 363,892 240,234
Pseudo R-squared 0.989 0.978

Note: The table shows the average post-event treatment effects for the first and second quarters after treatment. We followed de Chaisemartin & D’Haultfoeuille (2022) to calculate the average post-event treatment effects. All regressions include province-country-event-year and province-country-event-month fixed effects. The standard errors are adjusted for within-cluster correlation at the province-country level. ***, **, and * indicate statistical significance at the 1 percent, 5 percent, and 10 percent confidence levels, respectively.

Figure A
Figure A.Falsification tests for November 2010

Note. The figure shows the dynamic treatment estimates, 95 percent confidence intervals, and uniform sup-t bands for the event-time coefficients. The event time is measured in months relative to the treatment. We centered the event studies around the placebo treatment month of November 2010. We report average post-event treatment effects, Wald tests for pre-trends, and regression statistics in the figure notes. All regressions include province-country-event-year and province-country-event-month fixed effects. The standard errors are adjusted for within-cluster correlation at the province-country level. We plot the dynamic treatment parameters and 95 percent confidence intervals for the event-time coefficients.

Figure B
Figure B.Subtracted linear pre-trends

Note. The figure shows the dynamic treatment estimates, 95 percent confidence intervals, and uniform sup-t bands for the event-time coefficients. The event time is measured in months relative to the treatment. We centered the event studies around the end of the zero-Covid policy in November 2022. We overlaid deterministic unit-specific linear trends in panels (a) and (c) and subtracted them in panels (b) and (d) following the approach by Dobkin et al. (2018) and Freyaldenhoven et al. (2021). We report average post-event treatment effects, Wald tests for pre-trends, and regression statistics in the figure notes. All regressions include province-country-event-year and province-country-event-month fixed effects. The standard errors are adjusted for within-cluster correlation at the province-country level. We plot the dynamic treatment parameters and 95 percent confidence intervals for the event-time coefficients.