
I. Introduction
Extreme fluctuations in capital flows have become a concern for Emerging Market Economies (EMEs) in the post-global financial crisis (GFC) period. Primarily, two broad interrelated risks, namely macroeconomic and financial risks, are associated with these extreme fluctuations of capital flows (Ostry et al., 2012). Broadly, macroeconomic risks include overheating problems and extreme fluctuations in output. Similarly, financial risks include unsustainable credit growth and severe fluctuations in asset prices. Therefore, various capital control measures have been employed by several EMEs in recent times (IMF, 2018). Further, the International Monetary Fund’s (IMF) institutional view has argued for the systematic use of capital controls in the presence of macro-financial fragilities due to the volatility of capital flows (IMF, 2012).
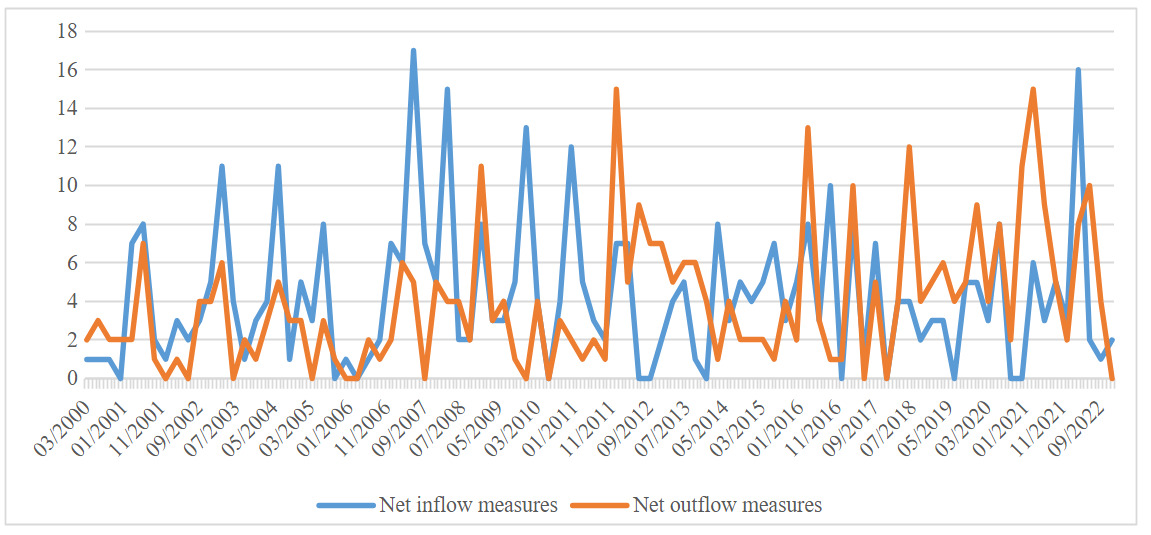
Very often, EMEs aim to minimize macro-financial risks by employing controls on capital flows to reduce the adverse effects of capital flows on macro-financial conditions (Das & Ordal, 2022). There are two types of capital control measures: net capital inflow measures and net capital outflow measures. According to Binici and Das (2021), net capital inflow measures aim to mitigate the overall impact of capital inflows by either restricting inflows (tightening capital controls on inflows), facilitating outflows (easing capital controls on outflows), or implementing a combination of both. On the other hand, net capital outflow measures are designed to limit massive capital flight by either restricting outflows (tightening capital controls on outflows), facilitating inflows (easing capital controls on inflows), or implementing a combination of both, thereby reducing financial vulnerabilities and preserving macroeconomic stability. Thus, in this context, this study examines the role of macroeconomic and financial stability goals in driving both net inflow measures and net outflow measures in EMEs. The primary motivation behind this study comes from the fact that there has been an imposition of several net inflow measures and net outflow measures in the EMEs (Figure 1).
In the literature, there are two strands justifying the motivation behind capital controls: one is aggregate demand externalities, and the other is pecuniary externalities. The literature on aggregate demand externalities emphasizes the difficulty in aggregate demand management due to excess foreign borrowing in the presence of rigidity in the economy, constrained monetary policy, and lack of flexibility in the exchange rate (Farhi & Werning, 2014, 2016). So, capital controls need to be tightened during good times and eased during adverse conditions. In contrast, the literature on pecuniary externalities argues that the risk-taking behavior of private agents leads to over-borrowing of short-term foreign currency-denominated debt and balance sheet problems, which in turn result in deviations of market prices (such as credit growth and asset prices) from the equilibrium path (Jeanne & Korinek, 2010; Korinek, 2018). Therefore, there is a need for countercyclical capital controls over the fluctuations of credit growth and asset prices. Empirical studies such as Binici and Das (2021), and Das and Ordal (2022) also found that macroeconomic stability goals such as high output growth or inflationary pressure and output volatility, and financial stability goals such as credit growth and asset prices, lead to inflow and outflow controls on short-term flows, thereby supporting the macro-financial stability argument behind the drivers of capital controls.
Based on these arguments, we hypothesize that: (1) net capital inflow measures on short-term flows would increase during periods of macroeconomic risks like high output growth or inflationary pressure, and financial stability risks like high credit growth and asset prices; (2) net capital outflow measures on short-term flows would increase during periods of drastic fall in output, credit growth, and asset prices; and (3) both net inflow and net outflow measures will increase during periods of output volatility to reduce uncertainty in the economy.
Our study follows a structured approach for testing these hypotheses. First, we construct net inflow and net outflow measures on short-term flows. Second, we employ the panel probit model with random effects to test the hypotheses. Third, the robustness test includes an alternative measure of output volatility to validate the baseline model.
Our empirical findings are as follows: (1) The probability of net inflow measures on short-term flows is driven by macroeconomic stability goals like output growth and output volatility; however, they do not respond much to financial stability goals. (2) The probability of net outflow measures on short-term flows responds to a fall in asset prices, but macroeconomic stability goals do not play a significant role in driving net outflow measures.
This study contributes to the existing literature on two grounds. First, to our knowledge, the present study is the first attempt to construct net inflow and outflow measures that cover the COVID-19 period. Second, this study is the first attempt to test the relative importance of macroeconomic and financial stability goals in driving net inflow measures and net outflow measures in EMEs.
The rest of the paper is structured as follows. Section II presents data and methodology. Section III provides a discussion of the empirical findings and robustness test. Finally, Section IV concludes the paper.
II. Data and Methodology
A. Data
We utilize data from 2000Q1 to 2022Q4 for 18 EMEs- Argentina, Brazil, Chile, China, Colombia, Czech Republic, Hungary, India, Indonesia, Malaysia, Mexico, Philippines, Poland, Russia, South Africa, South Korea, Thailand, and Turkey. The selection of these EMEs is based on the IMF World Economic Outlook and Pasricha et al. (2015). These countries have been particularly active in imposing capital controls on inflows and outflows. We construct net inflow and net outflow measures of portfolio flows and other investments by following the approach of Pasricha et al. (2015).[1] We code -1 for the removal or easing of a policy measure, 1 for the introduction or tightening of a measure, and 0 for no change in the measure. The resulting data is then aggregated to a quarterly frequency by summing all the easing and tightening measures available at the daily frequency. In line with Ostry et al. (2012) and Binici and Das (2021), we include the growth rate of the log of real GDP and output volatility (measured as the rolling standard deviation of the log of real GDP over the past six quarters) as proxies for macroeconomic stability, and year-over-year growth of the log of credit and asset prices as proxies for financial stability. The study also includes several control variables, such as proxies for exchange rate regimes, inflation targeting (IT) regimes, the global financial crisis (GFC), and COVID-19.[2] While net inflow measures and net outflow measures are sourced and coded from the Annual Report on Exchange Arrangements and Exchange Restrictions (AREAER), real GDP data is sourced from the IMF and CEIC. Similarly, we extract data on credit growth and asset prices from the BIS and CEIC.
B. Methodology
The study employs the panel probit model with random effects, as this approach provides unbiased estimates and consistent standard errors when analyzing data that combines pooled cross-sections and time-series observations (Leblang, 1997). The baseline model is as follows.
Y∗it=β1Xit−1+γt+εit
Where is the latent variable that takes the value one when net inflow measures or net outflow measures on short-term flows are in place and takes the value zero otherwise. represents the vector of one-period lagged explanatory variables, included to control for reverse causality, and consists of proxies classified under macroeconomic and financial stability risks. However, for the exchange rate regime, IT regime, GFC, and COVID-19, we do not apply any lag since they are categorical variables. indicates the unobserved individual-specific effect, and is the disturbance term.
III. Results
Table 1 reports the results utilizing the panel probit model with random effects. First, the table shows that macroeconomic stability goals tend to drive net inflow measures related to short-term flows in the sample EMEs. For instance, the probability of net inflow measures on short-term flows increases by 0.013% at the 5% significance level and by 0.174% at the 10% significance level in response to output growth and output volatility, respectively. These measures are likely undertaken to reduce inflationary pressure driven by high output growth and to address economic uncertainty resulting from output volatility. However, these measures do not strongly respond to growth in credit and asset prices, as reflected in the insignificant estimated coefficients. This may be because policymakers in EMEs respond to a broad set of policies, such as prudential regulations, capital controls, and currency-related measures, to address net capital inflows-led financial risks (IMF, 2018). This result aligns with Binici and Das (2021) and Das and Ordal (2022), who argue that macroeconomic stability goals play a significant role in driving inflow controls on short-term flows.
Second, output growth, output volatility, and credit growth do not significantly drive the probability of net outflow measures on short-term flows. However, these measures respond to a fall in asset prices; a 1% decline in asset prices is associated with an increase in the probability of net outflow measures by 0.489% at the 10% significance level. This may occur because a fall in asset prices may signal capital flight, thereby leading to a higher probability of an increase in these measures. These results remain consistent when we perform the robustness test. The baseline results do not change when we include an alternative measure for output volatility by taking the rolling standard deviation of real GDP over the past eight quarters (Table 2).
IV. Conclusion
This paper examines the role of macroeconomic and financial stability goals in driving the net inflow and outflow measures related to short-term flows for eighteen EMEs. Utilizing the panel probit model with random effects, we find that macroeconomic stability goals, such as output growth and output volatility, drive the probability of net inflow measures. However, these measures do not respond significantly to financial stability goals. On the other hand, financial stability goals, such as a fall in asset prices, lead to an increase in the probability of net outflow measures. Conversely, macroeconomic stability goals do not play a significant role in driving net outflow measures.