I. Introduction
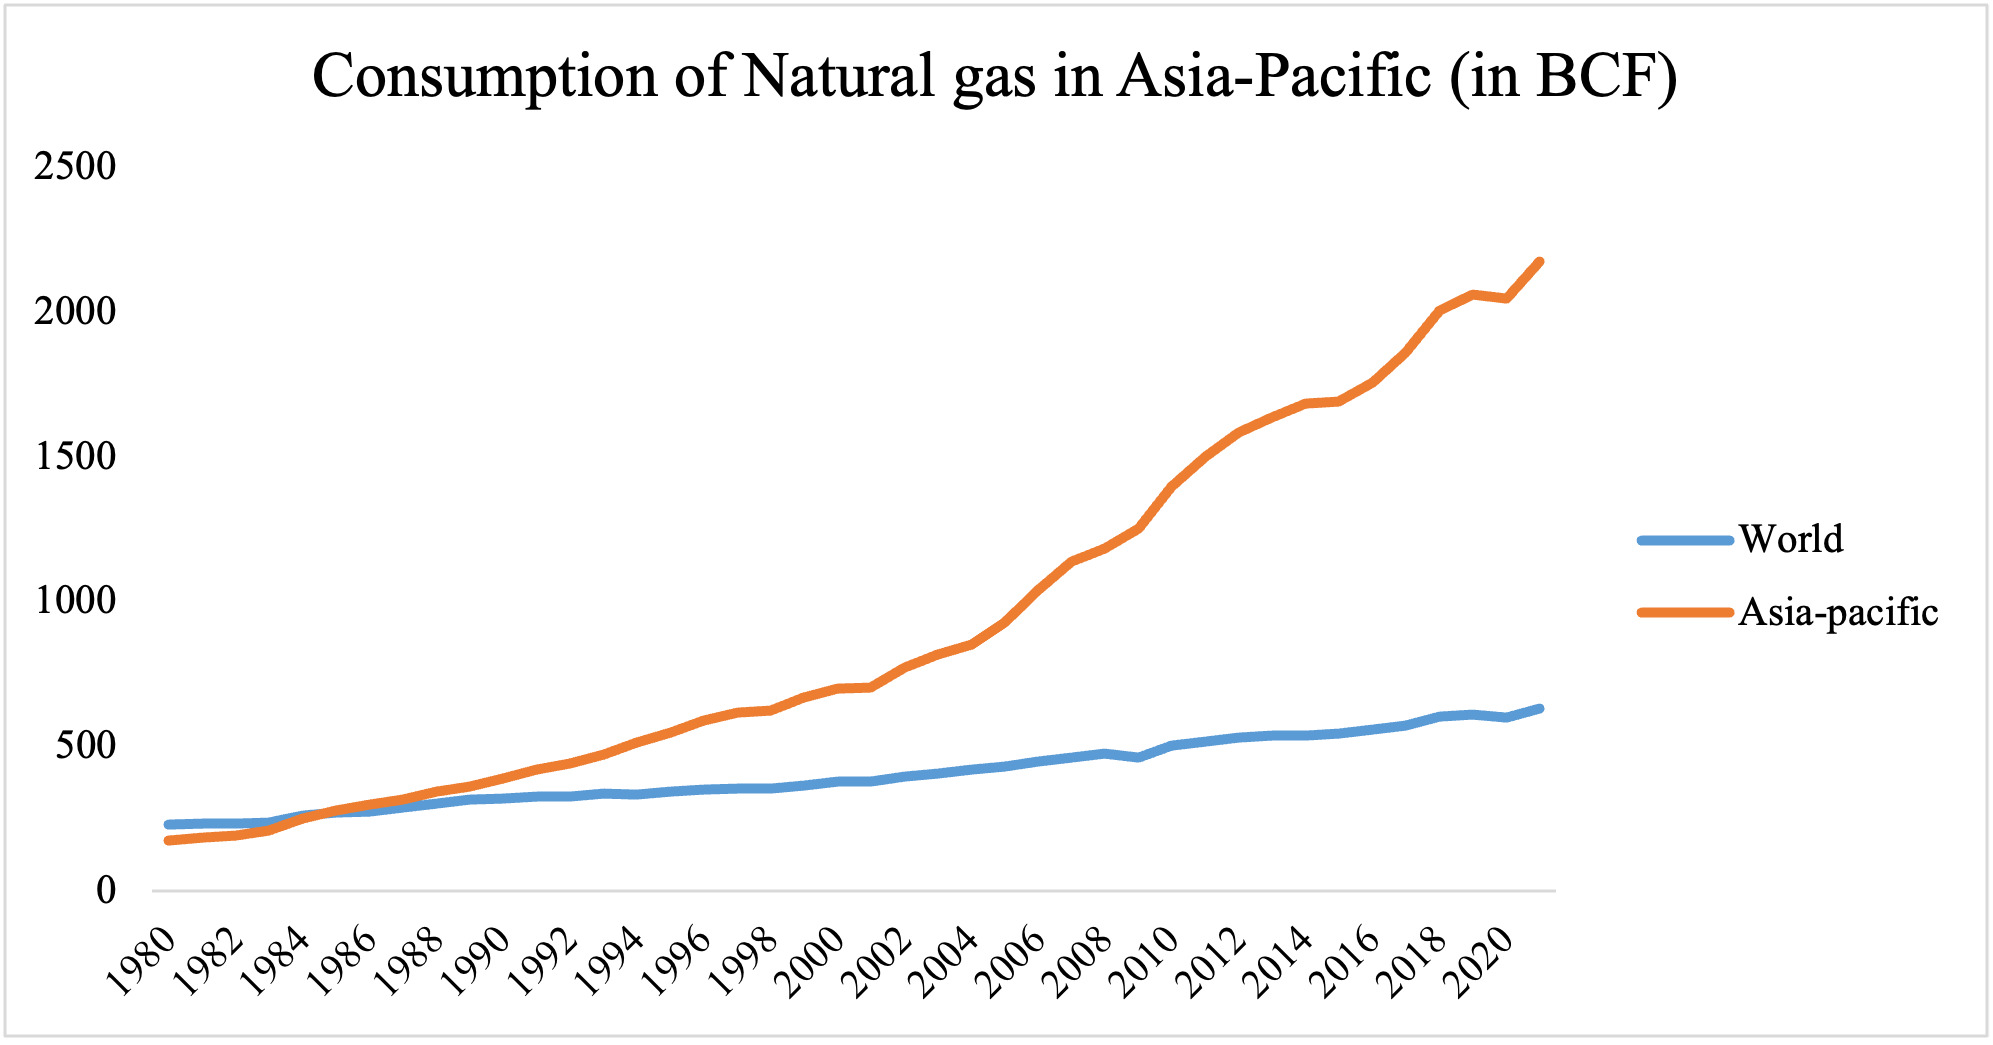
The large-scale structural transformation led to pro-industrial and service-dominated economies across the world. However, such transformation was not only restricted to enormous output growth, but was also coupled with high energy consumption, industrial wastage, emissions, and global warming—drawing attention to the need for a global action plan towards clean growth (Stern, 2007). Acemoglu et al. (2012) suggest that a combination of research subsidies and carbon taxes would redirect technological change towards a cleaner growth path. It is evident that the transition towards decarbonised energy systems is dominated by renewable energy solutions. However, given resource constraints and low levels of technological capability, most developing and transitional economies may depend on conservative solutions that complement renewable energy resources to contain emissions. For example, according to the Energy Institute, the Asia-Pacific region requires more than USD 88.7 trillion to meet the Paris commitments, but the region’s conventional R&D investment is far below that of the USA, EU, and OECD.[1] On the other hand, Asia-Pacific nations consume a sizable amount of natural gas, making it the largest consuming region after North America (see Table 1); the growing significance of natural gas consumption in the region is far above the global average (see Figure 1). Given this backdrop, the present paper empirically examines the productive role of natural gas in the transition towards cleaner growth for these countries in the region.
Considering the high level of gas consumption, we have chosen Asia-Pacific economies to study this objective. The study enables us to understand the usage of natural gas in achieving cleaner growth in the sample countries. To the best of our knowledge, this is the first panel study to examine the relationship between natural gas consumption and economic growth in Asia-Pacific economies. However, previous studies have emphasised the role of natural gas consumption in the growth process with a comprehensive futuristic view, focusing on the energy mix and the role of technological advances in mitigating emissions, particularly when industrial energy use causes pollution (Johnson et al., 2025; Tao et al., 2023).
The study employs the Panel Corrected Standard Errors (PCSE) model, which is appropriate to address the existence of cross-sectional dependence and heterogeneity among the countries (Nepal et al., 2022). Using time series data of 14 countries from the region, spanning from 1990 to 2020, the study reveals that the consumption of natural gas has a significant and positive impact on economic output. Therefore, it is imperative to develop natural gas markets in the sample countries to achieve a cleaner growth path. Such achievements help to pressurise other national counterparts in the international arena to cut emissions by meeting medium-term, self-imposed targets. This is the key reason behind selecting the major gas-consuming region.
The rest of the paper is organised as follows. Section II summarises the data used for empirical purposes. Section III outlines the appropriateness of the methodology employed to study the objective. Section IV discusses the results, and Section V concludes.
II. Data
For empirical purposes, we use the following variables: Natural Gas Consumption (BCF), measured in billion cubic feet; net adjusted savings[2]; GDP (constant 2015 US$); total labour force; gross capital formation (constant 2015 US$); and trade (% of GDP). All variables are converted into natural logarithms for the estimations. Data on GDP, trade, capital, and labour are collected from the World Development Indicators (WDI), while natural gas data is extracted from the Energy Institute, Statistical Review of World Energy.
.png)
Several countries are major gas consumers in the region, as listed in Table 1. Countries such as China, Japan, India, Australia, Malaysia, South Korea, and Indonesia have the potential to leverage the transition towards clean growth through increased gas consumption. The average natural gas consumption in the region has been significantly higher than the global average since the mid-1980s (see Figure 1). Table 2 provides descriptive statistics along with definitions of the variables used in the study.
Despite the current trajectory of the trend shown in the figure above, there is a growing debate within the literature on how the transition will take place going forward, given that transition scenarios differ from country to country. Under tightening climate policy targets, aggregate global natural gas consumption is likely to decrease in the coming decades (Dubey et al., 2023); however, it may continue to increase in regions such as Asia-Pacific before peaking by the year 2100. Achieving clean growth targets without hindering developmental projects, particularly in low-income regions such as Asia and Africa, is desirable. Therefore, the consumption of natural gas and its role in the transition will play a significant role in the growth of the top natural gas-consuming countries (Olawuyi, 2022; Safari et al., 2019).
III. Methodology
The present study uses panel unit root tests, specifically the Pesaran CD test (2004) and the cross-sectionally augmented IPS (CIPS) test (Pesaran, 2007), to address cross-sectional dependency. The study also accounts for the presence of structural breaks in the data using the modified unit root tests developed by Narayan and Popp (2010) and Narayan and Liu (2015). Furthermore, to analyse the key hypothesised relationship, we employ the Panel Corrected Standard Errors (PCSE) model. Our specification can be written as follows:
lnYit=β0+β1lnNGasit+β2lnCapit+β3lnLabit+β4lnOpenit+eit
Where denotes economic growth, denotes natural gas, denotes capital, denotes labor, denotes trade openness, i represents the panel of countries, and t denotes period.
The application of the PCSE model, the unit root test (Pesaran CD test), and cross-sectional dependence (CIPS) tests are appropriate given the nature of the data and country characteristics. The PCSE model offers several advantages when dealing with panel data, as it addresses heteroscedasticity, serial correlation, and cross-sectional dependence. This model is more suitable in the presence of panel error components and cross-sectional dependence, as compared to the GMM approach (Anser et al., 2024). For the robustness check, we use net adjusted savings data to capture sustainable economic performance.
IV. Results
Estimated results are reported in Table 3, which is further categorised into three panels. Panel A presents the unit root test results, revealing the existence of unit roots with structural breaks in the data; to address this, we use a dummy variable for the break year. Panel B displays the cross-sectional dependency. Panel C reports the results of the PCSE model, confirming a positive and significant relationship among the variables, particularly highlighting the positive impact of natural gas on economic output observed in Asia-Pacific nations.
Empirical findings confirm the impact of natural gas consumption on economic growth along with other variables (see Panel C). Our results demonstrate not only statistical significance but also economic relevance. The use of natural gas for sustainability and developmental activities could be a superior choice, as mentioned by Dubey et al. (2023). Regionally, the usage of natural gas may differ, but in the pursuit of climate goals alongside developmental activities and given the scarcity of resources to invest in cleaner technologies, natural gas consumption potentially plays an active role that eases the transition path, acting as an intermediary between dirty and cleaner technology adoption in the region. Furthermore, while deploying alternatives and strategizing for cleaner technologies, the Asia-Pacific region may rely relatively more on conservative options such as natural gas to meet developmental goals during these pressing decades of transition. Additionally, country-level cointegration results also reveal a positive association from natural gas to economic growth, except in countries such as New Zealand, Pakistan, and Vietnam (results are not reported here due to space constraints; they are available upon request). The study emphasises the significance of natural gas, especially for the countries in the sample, as they are highly dependent on natural gas consumption.
Results with net adjusted savings data from the PCSE model show similar findings.[3] This ensures the reliability and validates our results reported in Panel C of Table 3.
V. Conclusion
This paper examined the role of natural gas in the economic growth of nations in the Asia-Pacific region. In fact, these countries may be considered to be utilising what is often referred to as the “golden age” of natural gas, as many analysts have predicted. Prospectively, natural gas is poised to deliver on its dual objectives of supporting development that embodies economic growth aligned with cleaner energy. Our study is consistent with the existing literature, which shows that the consumption of natural gas reduces emissions compared to coal usage, making it an attractive policy instrument during the transition period (see: Gursan & de Gooyert, 2021). Our evidence contributes to this body of literature. The key inference drawn from the empirical analysis carried out in this paper is that encouraging natural gas consumption significantly promotes economic growth while reducing emission content. Therefore, the central policy suggestion is to actively engage in and promote natural gas markets in the region, even while pursuing alternative energy sources, during the green transformation.
Though some countries in the region such as Japan, South Korea, Thailand, and lately China heavily invest in advanced technologies, overall region’s capability is lower than that of required, moreover the study emphasises that “natural gas” complements or ease the journey towards to decarbonisation (Olawuyi, 2022).
Which accounts for the national income available for the future purpose of consumption and investment, considered as the sustainable national income indicator.
The coefficient of net adjusted savings is positive and statistically significant. Other results are consistent with those reported in Panel C of Table3.