I. Introduction
Statistics indicate that industry and fossil fuels (coal, oil, and gas) accounted for approximately 91% of CO2 emissions in 2022, making them major contributors to global warming as greenhouse gases (International Energy Agency, 2023). In China and India, crude oil constitutes a significant source of energy. China and India rank second and third globally in terms of crude oil consumption, respectively (EIA). Empirical studies reveal a positive correlation between crude oil consumption and economic growth in this context (Chen et al., 2023; Hammoudeh et al., 2014). However, economic growth and rising energy consumption are often associated with urbanisation and industrialisation (Li et al., 2011; Liu, 2009; Zhang & Lin, 2012). Increased energy use resulting from economic growth may exacerbate environmental degradation. To capture non-linear dependencies, this study employs a copula-based approach to investigate the dynamic relationship between crude oil consumption and CO2 emissions in China and India.
We acknowledge the significant influence of crude oil consumption on environmental degradation in our investigation of global sustainability, especially when viewed through the lens of the Energy Kuznets Curve (EKC). We aim to link this energy-centric perspective with the established Environmental Kuznets Curve, as economic expansion frequently results in higher energy consumption. According to the EKC theory, pollution rises initially but eventually falls as countries reach a certain income threshold, indicating a non-linear relationship between economic growth and environmental impact (Grossman & Krueger, 1991; Panayotou, 1993; Selden & Song, 1994). Furthermore, given that China and India have experienced substantial economic growth over the past 50 years, it is crucial to examine the relationship between their oil consumption and carbon emissions. Statistics show that their economic growth is directly linked to their energy usage. Both countries predominantly rely on coal and oil consumption to meet their energy demands, and CO2 emissions have increased in tandem with rising energy consumption. It is also noteworthy that, since 1970, when they were nearly equal, China’s GDP per capita has grown to around ten times that of India (World Development Indicator).
Our study contributes to the existing literature in three main ways. Firstly, it examines the crude oil and CO2 emission statistics for China and India, which together constitute a substantial proportion of global CO2 emissions (according to the World Development Indicators). Secondly, as both nations are among the top consumers of crude oil globally, it is imperative to explore their dynamic relationship. Finally, to the best of our knowledge, this work is unique in demonstrating their connection using copula analysis. We analyse the correlations and joint distributions between crude oil usage and CO2 emissions. This research offers a versatile framework capable of capturing both linear and nonlinear connections. Our objective is to disentangle these interdependencies, investigate their nuances, and provide insights for informed policymaking within the framework of sustainable development. Copula analysis was employed because it is now essential to understand the intricate links between crude oil and carbon emissions. This approach is renowned for its adaptability in capturing joint distributions and presents a useful means to explore complex interactions that conventional methods may overlook. The application of copulas is justified in this study, highlighting their versatility and applicability across various sectors.
The reminder of the paper is organised as follows: Section II discusses the data sources and methodology used in the study. Section III presents the analysis of the results. Finally, Section IV offers the conclusion and outlines the policy implications.
II. Data and Methodology
A. Data
We have collected annual data on CO2 emissions per capita and crude oil consumption for China and India from the U.S. Energy Information Administration (EIA) database, which is published by the U.S. Department of Energy and covers the period 1970–2022. We also obtained GDP per capita statistics for both nations from the World Development Indicators released by the World Bank. We calculate the data as the log difference between consecutive years using the CO2 data. This is because environmental data, especially CO2 emissions, frequently exhibit trends and variations that are not consistent across time. By employing log differencing, we attempt to stabilise the data, thereby reducing the difficulties associated with trended series. This method successfully eliminates such tendencies, enabling us to focus on short-term dynamics. Our models provide insights into the mechanisms driving CO2 emissions over time by detrending the series to capture the immediate impact of changes in economic variables and crude oil consumption.
B. Methodology
To capture the marginal distribution of carbon and oil emissions, we employed a linear regression model to retrieve the filtered residuals, which is crucial for this analysis. The primary challenge encountered was multicollinearity, which arises when independent variables within a regression model are correlated. Although we initially utilised linear regression models, this issue made it more difficult to discern how each parameter affects the overall model, thereby impeding the ability to draw accurate conclusions. Despite manipulating certain data measures, such as increasing R-squared values, multicollinearity problems prevented the results from offering comprehensive insights. This underscores the necessity for a different approach.
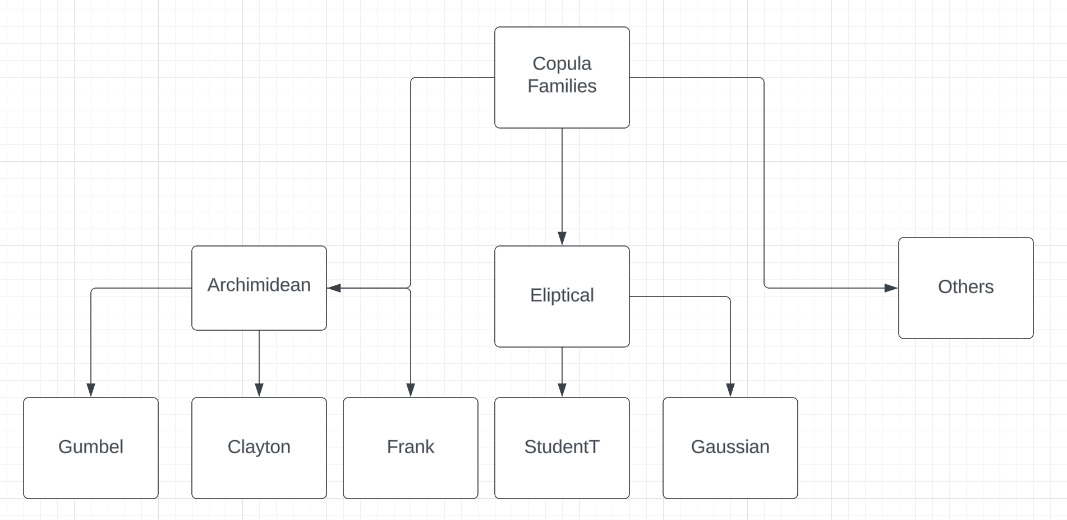
To address this complexity, a viable solution lies in the utilisation of copulas, a probability model used for representing a multivariate uniform distribution, thereby examining the association or dependence among multiple variables. This approach involves the application of intricate mathematical models to facilitate a comprehensive study. For example, when evaluating the interdependence of returns for two or more assets, conventional methods often resort to the correlation coefficient. However, the effectiveness of correlation is optimised in scenarios featuring normal distributions, which contrasts with the prevalent non-normal nature of distributions. Thus, the copula method proves particularly advantageous in handling complexities associated with non-normal data. Figure 1 shows the various copula families.

Copula analysis offers important insights into the joint behaviour of variables, even though it may not always capture extreme occurrences, often referred to as “fat tails”, that happen more frequently than would be expected under a normal distribution.
III. Results
Copula analysis is used to investigate the non-linear relationship between oil consumption and carbon emissions. To ensure an effective model fit, we evaluated several Copula families, with the results shown in Table 1 for China and Table 2 for India. We assessed the different Copula family types and selected the optimal Copula based on the Log Likelihood, AIC, and BIC criteria. The findings are displayed in Tables 1 and 2, respectively.
The assessment of copula models in both the Indian and Chinese contexts showcases robust metrics regarding model fitting and the interplay between CO2 emissions and crude oil consumption. Table 2 presents the fitted copula families for India, indicating that the positive log-likelihoods across all copula models suggest a favorable fit. Specifically, these log-likelihood values represent the logarithm of the likelihood function, which measures the probability of observing the given data under the assumptions of the selected copula model. Notably, the Gumbel Copula emerges with the lowest AIC and BIC values. The prominence of the Gumbel Copula in achieving the best fit within the Indian context implies several crucial aspects. Primarily, it suggests that the Gumbel Copula most accurately captures the relationship between CO2 emissions and crude oil consumption in India among the evaluated copula models. Its superior performance in terms of AIC and BIC values signifies a higher likelihood of accurately representing the underlying dependence structure between these variables compared to other copula models. This outcome indicates a potential reliance on tail dependence, a characteristic well-captured by the Gumbel Copula, when modeling the joint behavior of CO2 emissions and crude oil consumption within the Indian context. Consequently, this finding underscores the significance of tail dependence in understanding and predicting the dynamics between these crucial factors in India’s energy landscape. High oil consumption raises carbon emissions, according to the Gumbel Copula findings, which show an upper tail dependence between the two variables in India. On the other hand, Kendall’s Tau is a statistical measure used to assess the ordinal association between two measured quantities. It quantifies the degree of correspondence or similarity in ordering pairs of observations across two variables. This statistic provides a value between -1 and 1, with -1 indicating perfect inverse association, 0 indicating no association, and 1 indicating perfect agreement in rankings between the two variables. In this case, Kendall’s Tau and Spearman’s correlation coefficients measure the dependence between CO2 emissions and crude oil consumption and consistently exhibit positive values, affirming a direct positive correlation within the Indian context. With a Kendall’s Tau value of 0.166, it is clear that rising carbon emissions are a direct result of rising crude oil consumption. This implies a pro-cyclical connection in which carbon emissions and oil consumption are rising in tandem.
In the parallel assessment of China in Table 2, positive log-likelihoods are also observed across all copula models. Here, the Frank Copula stands out with the lowest AIC, while the Gumbel Copula shows the lowest BIC, suggesting their potential as superior models within the Chinese framework based on these metrics. In this specific analytical context, where CO2 emissions and oil consumption are the variables under scrutiny, the comparative analysis of copula models based on AIC and BIC values yields crucial insights. The lower AIC associated with the Frank Copula implies that, among the considered copula models, it presents a better balance between model goodness-of-fit and model complexity when examining the dependency structure between CO2 emissions and crude oil consumption in China. This demonstrates that there is a symmetrical link between oil consumption and carbon emissions, meaning that both increase and decrease in tandem. The AIC, calculated as a function of the model likelihood and the number of parameters, favors models that fit the data well with fewer parameters. Conversely, the Gumbel Copula’s lowest BIC suggests its potential superiority in capturing the association between CO2 emissions and crude oil consumption within the Chinese framework when considering model selection based on a more stringent penalization for model complexity. The BIC, which incorporates a more substantial penalty for model complexity than the AIC, thus leans toward selecting models that effectively fit the data while preferring parsimonious models with fewer parameters. Therefore, from a technical standpoint, while the Frank Copula exhibits a better fit based on AIC, the Gumbel Copula showcases a preferable fit when considering BIC, indicating a nuanced trade-off between model goodness-of-fit and complexity when assessing the relationship between CO2 emissions and crude oil consumption in China. This highlights the importance of selecting an appropriate copula model that effectively characterizes the dependency structure between these variables while considering the trade-offs between goodness-of-fit and model complexity in the analytical framework. Similarly, in China, both Kendall’s Tau and Spearman’s correlation coefficients confirm a positive correlation between CO2 emissions and crude oil consumption. Our results are also corroborated by the findings of Hammoudeh et al. (2014); and Chen et al. (2023).
IV. Conclusion
China and India have generated significant CO2 emissions and crude oil consumption over time due to maintaining high development rates. However, a comparison of the rapid growth rates of China and India reveals notably distinct trends in crude oil consumption and CO2 emissions. Additionally, many micro-businesses in India use little energy and are not competitive enough to sell to other countries. Using copula analysis, we conclude that there is a moderately positive association between CO2 emissions and crude oil consumption. Although the model does not achieve a perfect fit, it provides valuable insights into the joint behavior of these variables. Understanding these relationships is crucial for making informed decisions, especially when balancing economic growth and environmental sustainability. Policymakers can use these insights to devise strategies that promote green GDP and mitigate the environmental impact of economic activities. This could involve incentivizing cleaner technologies and integrating environmental considerations into economic development plans.