
I. Introduction
Global interconnectedness and interdependence are a boon for promoting faster economic growth, market expansion, and labour and technology exchange across borders, but they can also be a bane, as global uncertainty—which may start in one corner of the globe—can engulf the entire world economy and have detrimental impacts. Global financial interdependence and connectedness manifest through cross-border trade, financial outflows and inflows, foreign exchange markets, global stock exchanges, and bond markets. Among these, exchange rates (ER) and stock markets are of particular interest because they are not only shock-transmission channels but also barometers of an economy’s health and credibility, which matter to all economic agents. At the micro level, speculative activities in the ER market can affect firms’ competitive strength, and at the macro level, speculation in the ER market influences an economy’s GDP and its trade relations. Stock markets play a crucial role in capital formation by mobilising investors’ savings into profitable sectors. Investors who receive positive returns on their investments increase consumption spending, which in turn boosts demand for goods and services.
Changes in currency values affect market dynamics, including interest rates and inflation, and thereby affect the economy and sectoral indices. The following theories emphasise the relationship between ER and stock market returns. Frankel (1983) and Branson (1983) found that robust stock market returns attract investment opportunities, strengthening demand for a country’s currency and thus enhancing its value. Conversely, Dornbusch and Fisher (1980) argued that ER affects an economy’s international competitiveness, balance of trade, and GDP growth. This influences future cash flows and investors’ expectations regarding the intrinsic value of domestic firms, which in turn affects stock prices. These theories point to a bidirectional relationship between ER and stock markets. Studies have also drawn on prominent models, such as the risk exposure model and asset pricing model, to highlight the causal connection between exchange rate movements and sectoral indices (Zarei et al., 2019). These theories suggest that parameters such as cash flows, valuations, and degree of competitiveness vary across industries.
Recent global disruptions, namely the COVID-19 pandemic, the Russia–Ukraine war, and the Palestine–Israel war, have further distorted ER and stock markets. This increases the importance of understanding fluctuations in these markets. As per Davis et al. (2021), “Looking more closely at the world’s two largest economies, the pandemic had greater effects on stock market levels and volatilities in the U.S. than in China even before it became evident that early U.S. containment efforts would flounder.”
Increased exposure to global shocks, positive or negative, results in exchange rate volatility, and such variations affect a country’s sectoral indices in addition to the overall stock market, albeit to varying degrees. Mishra (2004) found an inconsistent relationship among stock returns, ER returns, money demand, and interest rates in India. Sreenu (2023) found a significant long-run relationship between stock market returns and ER. Prabheesh (2020) found unidirectional causality from FPI flows to stock returns in India during the COVID-19 pandemic. Prabheesh and Kumar (2021) empirically analysed the dynamic relationship among ER, oil price returns, stock returns, and uncertainty shocks and found that COVID-19–induced uncertainty dampened the stock and oil markets. One missing aspect in this literature is the asymmetric impact of ER on stock returns in India. Jayashankar and Rath (2017) come close to this proposition by emphasising that the direction and type of relationship between ER, stock prices, and interest rates depend on frequency bands.
First, empirical studies have not sufficiently examined the asymmetric relationship between stock prices and ER in India. Second, exchange rates are an umbrella term with many variants—such as bilateral exchange rates with other countries and real and nominal effective exchange rates. India’s diplomatic and economic ties with the European Union (EU), as well as with Asian economies such as China and Japan, have grown substantially in recent decades through trade deals and investment inflows into major sectors such as services, IT, and manufacturing. In this context, a bilateral exchange rate between major economies and India may provide a clearer picture of how exchange rates affect the stock market than a weighted-average ER such as REER or NEER. This leads to the second research question: how do USD/INR, Euro/INR, Pound Sterling/INR, and Yen/INR affect sectoral indices?
Nifty 50[1] represents the 50 largest companies across all sectors, while Nifty sectoral indices track the performance of companies within a single sector. The Nifty India Manufacturing Index aims to track the performance of companies selected from the Nifty 100, Nifty Midcap 150, and Nifty Smallcap 50 indices based on six-month average free-float market capitalisation, broadly representing the manufacturing sector. The Nifty Services Sector Index includes companies that represent sectors such as Computers–Software, IT Education and Training, Banks, Telecommunication, and Financial Institutions, among others. As a result, the NIFTY 50 has lower risk due to greater diversification compared with a single sectoral index. Manufacturing and services are two major sectors that drive India’s economic growth. This motivates the third research question: while research often focuses on one aggregate index, Indian stocks also have sectoral indices that may behave differently. NIFTY Manufacturing and NIFTY Services are therefore chosen to understand how companies in two major GDP-contributing sectors respond to ER shocks. The study period is chosen to capture major events affecting India’s markets, namely demonetisation (2016), the COVID-19 pandemic (2020), and the general elections (2024).
The remainder of the paper is organised as follows. The structure of the paper is as follows: Section II details the methodology employed in the study. Section III discusses the data utilised. Section IV presents the empirical findings. Section V offers the concluding remarks.
II. Data and Methodology
A. Data
The study covers the period from January 2016 to September 2024. The variables considered are the bilateral of the Indian currency with respect to the US dollar, euro, pound sterling, and Japanese yen, the index of industrial production the consumer price index and the measure of nominal money supply and returns for three stock indices, namely the NIFTY 50, NIFTY Manufacturing, and NIFTY Services Sector. All variables are monthly series and are sourced primarily from the CEIC Database and the Reserve Bank of India (RBI) database. All variables are measured in natural logarithm.
B. Methodology
The study is based on the flow-oriented model (Dornbusch & Fischer, 1980), which explains how ER affects stock prices. To analyse the asymmetric long-run relationship between the variables, we employ the NARDL approach (Shin et al., 2014). Structural breaks for all variables are tested using Bai and Perron (2002), and the variables are adjusted for the identified breaks. We put forth a basic econometric model following the work of Fasanya and Akinwale (2022):
lnSectoral Retit=∝0+∝1lnERjt+∝2lnIIPt+∝3lnCPIt+∝4lnM2t+ut
where[2], indicates sectoral stock returns and i represents each sector. denotes bilateral and represents each bilateral ER, represents index of industrial production which proxies domestic economic activity, represents consumer price index which proxies price level, denotes nominal money supply, and represents white noise error term. All variables are tested for unit roots. The stock returns (dependent variable) are I(0), while the independent variables are a mix of I(0) and I(1).
III. Empirical Results
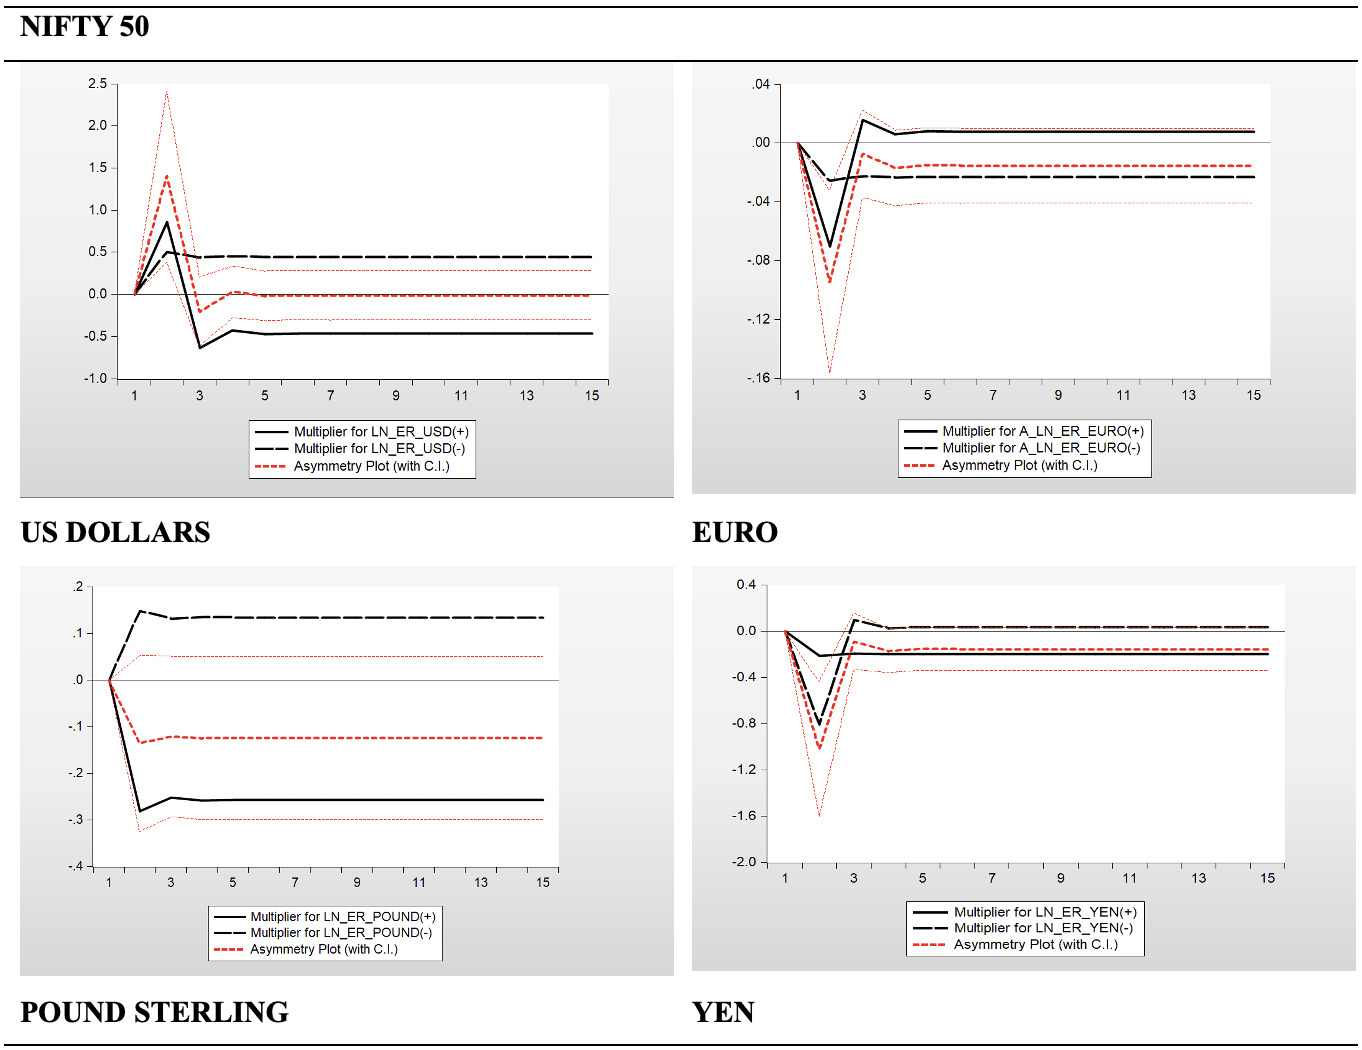
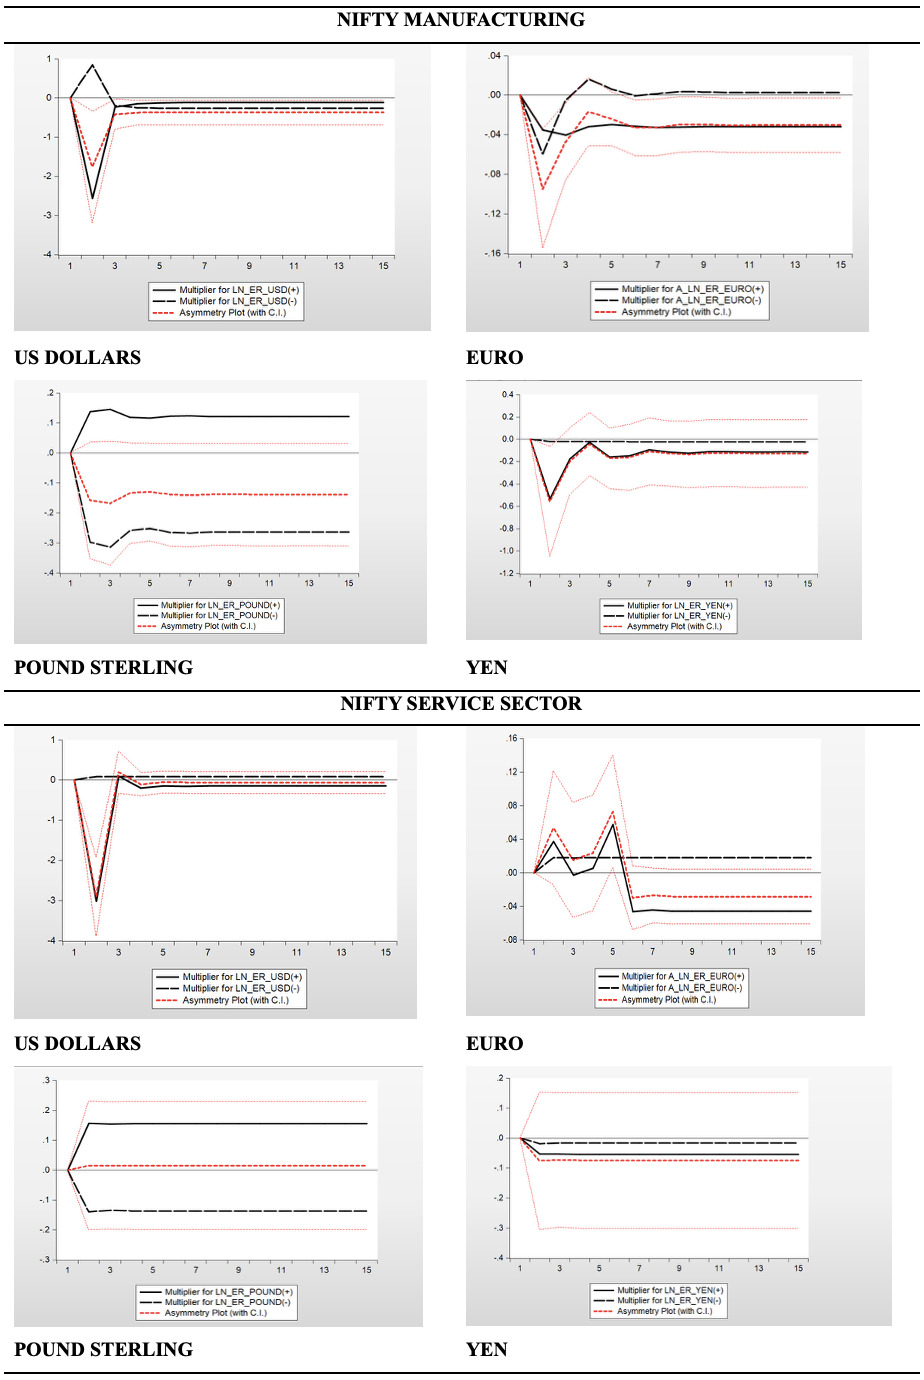
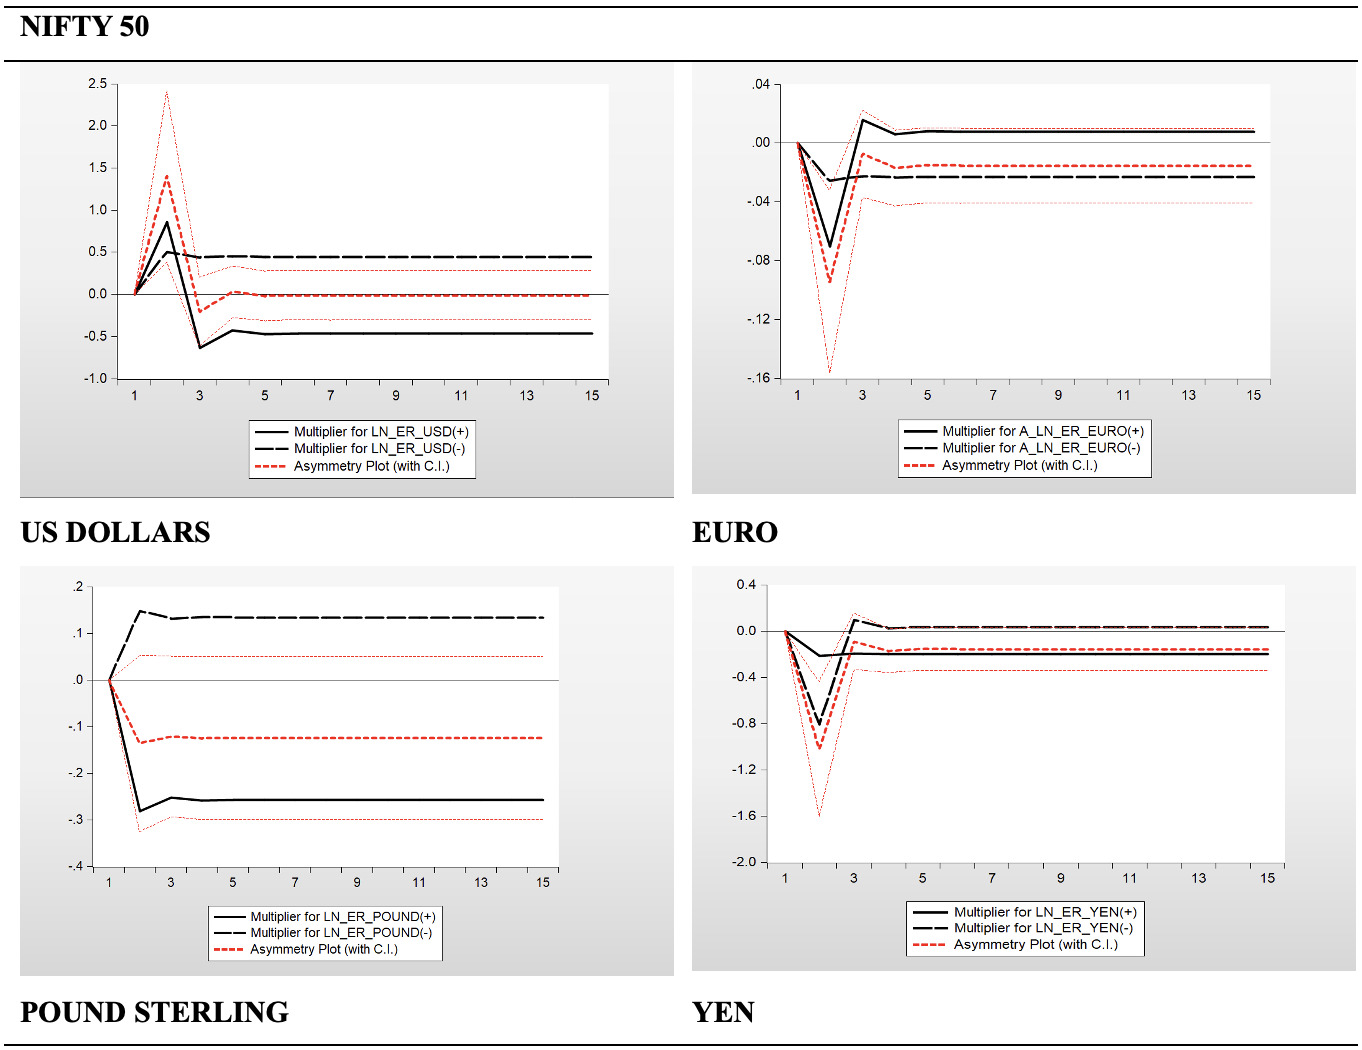
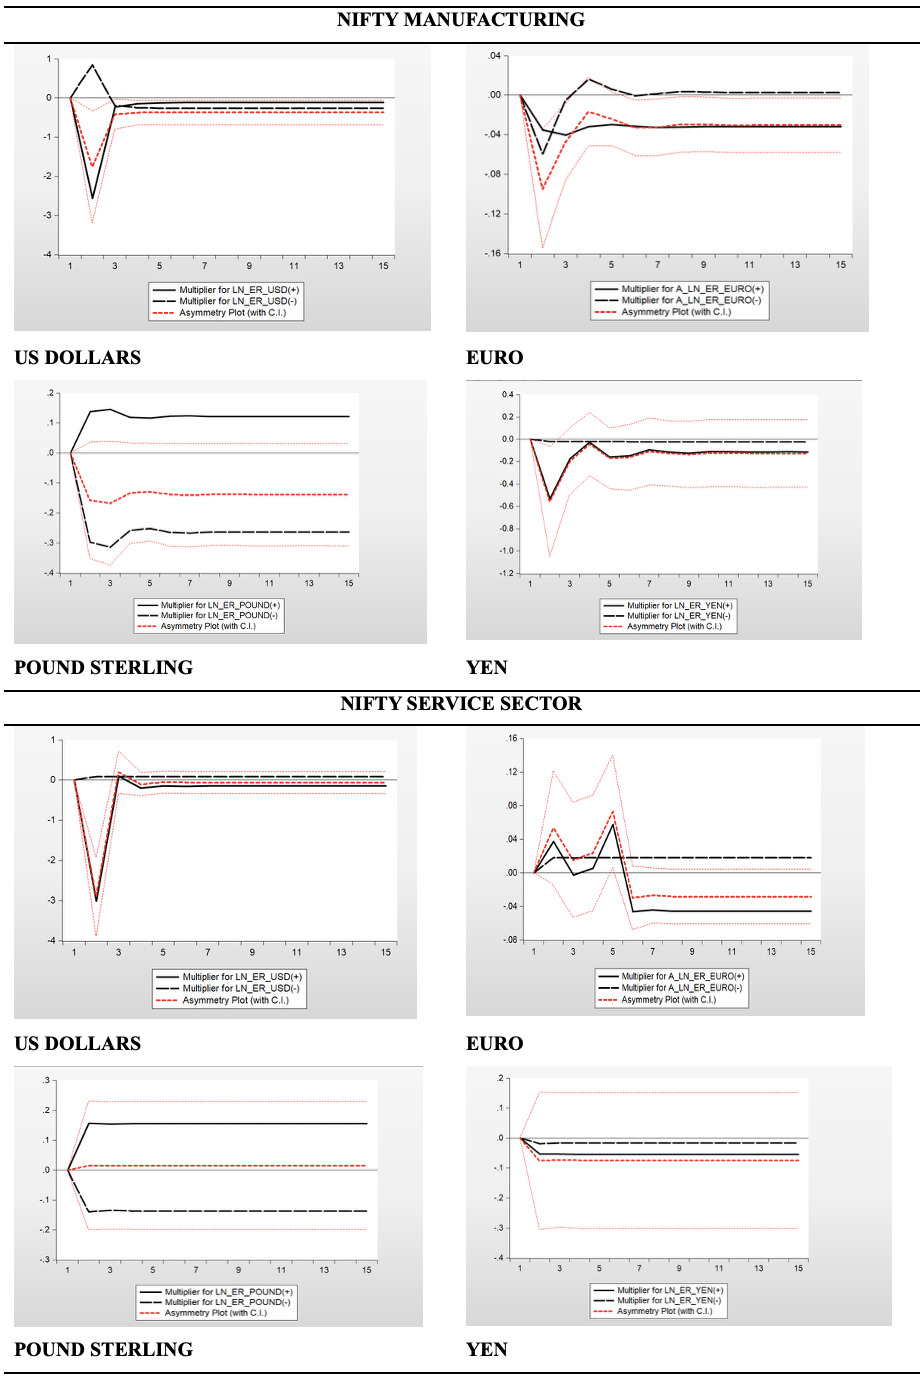
For NIFTY 50, a positive shock to the US Dollars/INR exchange rate negatively impacts stock returns at the 5% significance level (El-Diftar, 2023). A negative shock to the also has a negative influence on stock returns at the 10% significance level (Hau & Rey, 2005). The impacts of (Singh, 2016) and are insignificant. A significant positive influence of is observed at 5%, implying that rising prices can indicate robust economic growth and can positively affect stock markets (Maunsell, 2024). For NIFTY Manufacturing, both positive and negative shocks have an insignificant influence on stock returns. A significant and positive effect of is observed at the 10% significance level. is found to positively influence stock returns at 1%. No significant impacts are observed for the NIFTY Services Sector.
For the NIFTY 50, a positive shock to the Euro/INR has no significant effect on stock returns. A negative shock to the has a positive influence on stock returns at the 1% significance level. has a significant positive effect on stock prices at the 10% significance level. For NIFTY Manufacturing, a positive shock to the has a negative influence on stock returns at the 5% significance level. and have a significant positive influence at the 5% significance level. For the NIFTY Services Sector, a positive shock to the has a significant impact at 5%, while the negative shock is insignificant. The impact of is positive and significant at the 1% significance level.
As per Trade and Economic Security, European Commission, “The EU is India’s largest trading partner, accounting for €124 billion worth of trade in goods in 2023 or 12.2% of total Indian trade. EU’s share in foreign investment stock in India reached €108.3 billion in 2022, up from €82.3 billion in 2019, making the EU a leading foreign investor in India.” (EU Trade Relations with India, 2024). Thus, the EU has multiple channels through which it can influence India’s stock market and economy.
Beginning with the NIFTY 50, a positive shock to the Pound/INR exchange rate has a statistically significant negative effect on stock returns at the 10% significance level. No other outcomes were observed. No other shocks significantly affect NIFTY 50 returns. For NIFTY Manufacturing, negative shocks have a significant effect on stock returns at the 1% significance level. and have a significant positive influence at 1%. No significant impacts of shocks or other variables are observed for the NIFTY Services Sector.
Beginning with the NIFTY 50 index, a positive shock to the Yen/INR exchange rate exerts a negative impact on stock returns at the 10% significance level. Conversely, a negative shock does not exhibit any statistically significant effect. For NIFTY Manufacturing, neither positive nor negative shock has influence on stock returns. Both and have positive and significant effects on stock returns. No significant impacts of exchange rate shocks or other variables are observed for the NIFTY Services Sector.
NIFTY 50, NIFTY Manufacturing, and NIFTY Services Sector models for all exchange rates were found to be slightly unstable[3] in CUSUM of squares tests. However, no heteroskedasticity or autocorrelation was found.
IV. Conclusion
The study highlights a few major observations. First, shocks to India’s bilateral with the US dollar and the euro significantly influence the NIFTY 50, NIFTY Manufacturing, and NIFTY Services indices. However, shocks to the bilateral with the pound sterling and the yen have weak or no influence on these stock indices. Second, and are also significant factors influencing stock prices. Third, the models are better fitted for NIFTY Manufacturing than for the NIFTY Services Sector. Accordingly, each sectoral index should be evaluated alongside macroeconomic drivers and additional sector-specific factors, including bilateral that may have a particular influence on that sector.
Policymakers should also emphasise other currency bilaterals besides USD/INR. To obtain a clearer picture of stock markets, sectoral stocks should be studied individually using sector-specific variables and the macroeconomic factors that affect each sectoral index, rather than applying a generic model to overall stock indices. The government should consider sector-specific incentives—as in the Production Linked Incentive schemes for manufacturing—and strengthen digital infrastructure across sectors to support financial inclusion and improve market access. A safer investment environment, through stricter solvency and bankruptcy laws and less volatile bilateral supported by stronger financial integration, can help investors form better expectations and support future investment decisions.
https://www.niftyindices.com/indices/equity/sectoral-indices
A priori, bilateral exchange rates might have a positive or negative impact on sectoral returns (Hau & Rey, 2005; Katechos, 2011). CPI (Oxman, 2012), IIP (Fasanya & Akinwale, 2022), and M2 (Tiryaki et al., 2018) might also have a positive or negative impact on sectoral returns.
A mild peak beyond 95% confidence interval was observed which immediately returned within the 95% range. This points towards external shocks like COVID 19 pandemic.