
I. Introduction
This paper investigates the impact of renewable energy consumption and oil price shocks on the current account (CA) balance of oil-importing economies. The literature suggests that oil prices are pivotal in determining CA positions. Chinn & Prasad (2003) and Garg & Prabheesh (2017) affirmed that oil price is a critical factor influencing the CA balance, while more recent evidence by Chang et al. (2023), Juhro et al. (2024), and Hervino et al. (2025) highlighted the significant role of oil prices in shaping the CA balance of oil-importing economies. A surge in oil prices raises import costs, deteriorating the trade balance and exerting downward pressure on the CA. Notably, the volatility of oil prices amplifies this effect, as prices are subject to sudden shocks driven by financial crises (Prabheesh & Jayawickrema, 2025; Smyth & Narayan, 2018), geopolitical tensions (Qian et al., 2022; Zaghdoudi, 2025), global pandemics (Antonakakis et al., 2023), and terrorism (Narayan & Liu, 2011). Hence, the vulnerability of oil-importing economies to oil price shocks underscores the importance of transitioning to renewables, which posits dual benefits: reducing greenhouse gas emissions and reducing dependency on crude oil.
This study builds on the intertemporal CA framework, which defines the CA as the difference between national saving and investment (Garg & Prabheesh, 2018; Obstfeld & Rogoff, 1995). In this setting, an increase in oil prices acts as an adverse terms-of-trade shock, increasing import costs, reducing national savings, and deteriorating the CA. However, the transition to renewables lessens dependence on imported oil, improving the trade balance and strengthening the CA, though the impact unfolds gradually as new capacity is deployed (Bhattacharya et al., 2016). These channels provide the economic foundation for our empirical specification and motivate the use of local projections to trace the dynamic effects of renewable energy and oil-price shocks on the external balances of oil-importing economies.
Concerning the empirical literature on renewable energy transition and macroeconomic indicators, Bhattacharya et al. (2016) and Chen et al. (2020) analyse their effects on economic growth, while other studies explore relationships with trade openness (Zeren & Akkuş, 2020), trade policy (Usman et al., 2020), and the CA balance (Juhro et al., 2024). However, evidence on how different energy shocks influence the CA of oil-importing economies remains limited. This paper fills this gap by examining the effects of renewable energy consumption and oil-price shocks on the CA balance of oil-importing countries, further distinguishing between economies with persistent CA deficits and surpluses. To capture the dynamic responses, we employ the local-projection method of Jordà (2005), which estimates impulse responses using single-equation ordinary least squares and is more robust to model misspecification than traditional vector autoregressions (Jordà, 2023). Further, to enhance the reliability of our estimates, we employ Driscoll–Kraay standard errors (DKSE) and panel-corrected standard errors (PCSE), both of which correct for cross-sectional dependence and ensure robust results.
The findings of our study indicate that renewable energy transition positively influences the CA balance, with a pronounced effect emerging in the third and fourth years. This underscores the stabilising role of renewables in reducing dependence on oil imports. In contrast, oil price shocks exert a short- to medium-term adverse impact, peaking in the first two years before gradually fading. Further, we find that economies with persistent CA deficits experience an immediate positive effect from renewable energy, reflecting their high oil import dependence. In contrast, oil price shocks have a prolonged negative impact lasting up to three years. Conversely, surplus economies experience a more gradual but sustained improvement in the CA balance following renewable energy shocks, with the effect becoming dominant in the fourth year.
In contrast, oil price shocks have only a short-lived negative impact. These heterogeneous and horizon-specific responses advance the literature beyond earlier work such as Juhro et al. (2024). By uncovering how renewable energy provides immediate relief to deficit countries but a delayed benefit to surplus countries and employing local projections with robust error models, our analysis offers a new perspective on how energy transitions shape external balances and delivers fresh policy insights for oil-importing economies.
The remainder of the paper is structured as follows: Section II discusses the data and methodology, Section III presents the results of the study, and finally, Section IV concludes.
II. Data and Methodology
A. Data
This study has used the panel of 23 oil-importing economies, namely Australia, Belgium, Chile, China, France, Germany, India, Indonesia, Italy, Japan, the Netherlands, New Zealand, Poland, Portugal, Romania, South Korea, South Africa, Spain, Sweden, Thailand, Turkey, the United Kingdom, and the United States. Following Juhro et al.'s (2024) study, we have reclassified the sample of economies into CA deficit and surplus economies for a robustness check. We have used the annual data from 1990 to 2019 based on availability.[1] The CA to GDP ratio (cab) is the dependent variable, and real oil price (oil) and renewable energy consumption (rec) are the independent variables. Finally, the US’s real GDP (row), fiscal balance (fiscal), and real effective exchange rate (reer) are the control variables in the model.
B. Methodology
First, this study employs Pesaran (2021) and Juodis & Reese (2022) cross-sectional dependence tests to check whether each panel data is cross-sectionally independent. Based on the cross-sectional dependence test results, we employ the cross-sectionally augmented Dickey-Fuller (CADF) unit root test of Pesaran (2007). CADF is a second-generation panel unit root test, which is more efficient than first-generation panel unit root tests as it handles the issue of cross-sectional dependence by incorporating a cross-sectional average. After employing preliminary panel tests, we employ PCSE and DKSE panel regression. PCSE and DKSE provide robust standard errors addressing the issue of temporal and cross-sectional dependence.
Next, we employ the local projection model of Jordà (2005). Local projection is a standard model to examine the dynamic causal effects of shocks in macro empirical settings (Jordà, 2023). Local projection offers several advantages as it is a single equation set-up required to obtain impulse responses based on ordinary least squares (Auerbach & Gorodnichenko, 2012). In addition, local projections are more robust to misspecification than vector autoregressions because each impulse response is estimated using a distinct regression (Jordà, 2023). The model specifications for our study are as follows.
cabi,t+h=αi+βhreci,t+p∑j=1ρjcabi,t−j+q∑k=0γ1krowi,t−k+q∑k=0γ2kfiscali,t−k+q∑k=0γ3kreeri,t−k+q∑k=0γ4koili,t−k+φt+ei,t+h
cabi,t+h=αi+δhoili,t+p∑j=1ρjcabi,t−j+q∑k=0γ1krowi,t−k+q∑k=0γ2kfiscali,t−k+q∑k=0γ3kreeri,t−k+q∑k=0γ4kreci,t−k+φt+ei,t+h
In Equations (1) and (2), is the CA balance, is a renewable energy shock, is a real oil price shock, is the US’s real GDP, is fiscal balance, and is real effective exchange rate. are country fixed effects, are country fixed effects, is the error term, and and are impulse response coefficients at horizon h for renewable energy shock and real oil price shock, respectively.
III. Results
The preliminary results are presented in Table 1. The descriptive statistics and cross-sectional dependence test results are presented in Table 1 (see Panel A). The mean value of the CA balance is -0.312, indicating an average deficit across oil-importing economies. Renewable energy consumption has a mean value of 3.066, while real oil prices average 4.675, with significant variation. The cross-sectional dependence results employing the tests of Pesaran (2021) and Juodis & Reese (2022) suggest the presence of cross-sectional dependence as the null hypothesis is rejected. Next, we employ Pesaran’s second-generation panel unit root test (2007). The findings indicate that the variables are a combination of I(0) and I(1).
The results of PCSE and DKSE are reported in Table 2. Model 1 and Model 2 indicate the results without and with fixed effects. We find that the renewable energy consumption has a significant positive impact on the CA balance. The results suggest that the rise in renewable energy consumption reduces these economies’ dependence on crude oil, improving their CA balance. Further, we find that oil prices have a significant negative impact on the CA balance. The results suggest volatile oil prices adversely influence the CA balance, working through the import price channel. Concerning fiscal balance, we find that the twin deficit hypothesis holds.
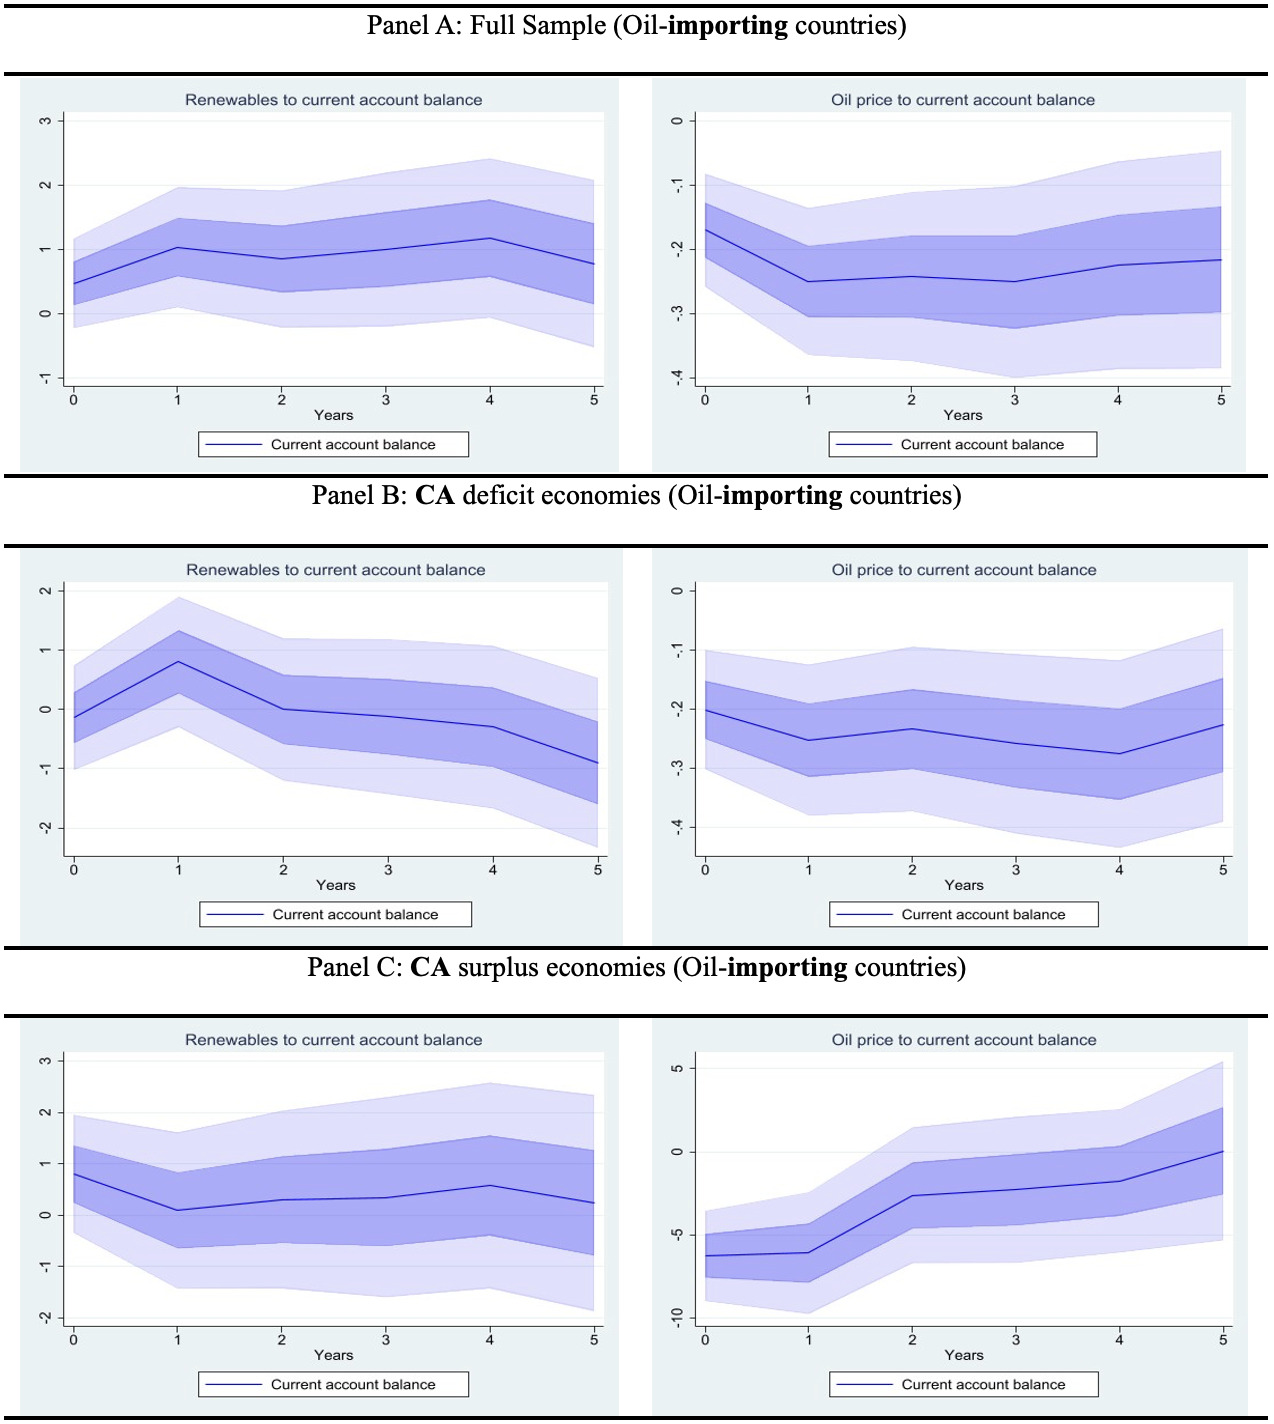
Next, we employ local projections to investigate how the CA of an economy responds to shocks in renewable energy consumption and oil prices. The results for the local-projection analysis for the full sample are presented in Figure 1 (Panel A). The findings indicate that the CA balance positively responds to shocks in renewable energy consumption. The CA balance steadily improves over time, with a pronounced effect during the third and fourth years after the shock. The findings imply that renewable energy stabilises the CA balance, mitigating reliance on oil imports and exposure to oil price volatility. The delayed impact highlights the investment lag in renewable energy infrastructure and the time required for such investments to yield economic benefits. The real oil price shock negatively impacts the CA balance. The adverse impact peaks during the first two years, after which it gradually diminishes. These results imply that an oil price shock has a short- to medium-run adverse influence on the CA balance. The findings of our study align with the theoretical expectation that oil-importing economies typically face increased import bills associated with rising oil prices. The gradual reduction in the adverse effect may be linked to economies adjusting their energy consumption patterns, implementing policy responses, or improving energy efficiency to mitigate the impact of rising oil prices.
.png)
Next, we have disaggregated the full sample of oil-importing economies into economies experiencing sustained CA deficits and surpluses. Concerning CA deficit economies, we find that the renewable energy shock has a positive and immediate effect on the CA balance. The findings indicate that investment in renewable energy in economies experiencing sustained CA deficits yields faster returns attributed to higher oil import dependence. Further, the results indicate that the substitution effect attributed to the transition from oil to renewables will favourably impact the CA balance of economies experiencing sustained deficits. The results suggest that oil price shocks have a prolonged negative impact on the economies experiencing sustained CA deficits. The negative effect is sustained until the third year, indicating that these economies are vulnerable to oil price volatility.
The findings concerning CA surplus economies are presented in Figure 1(see Panel C). The results suggest that a renewable energy shock positively but gradually affects the CA balance. The shock’s positive impact dominates in the fourth year, indicating that renewable energy adoption may take longer to materialise into a favourable impact on the CA balance. The gradual effect may also reflect a more systematic and strategic integration of renewable energy investments in surplus economies. The findings regarding the oil price shock on the CA balance indicate that the negative impact is short-lived, with the effect dissipating within two years. These findings imply that these economies can diversify energy sources, and a substantial trade surplus can significantly influence the CA balance. Additionally, surplus economies may have more effective policy mechanisms, such as energy reserves or hedging strategies, that buffer the immediate impact of oil price volatility.
IV. Conclusion
This study investigates the impact of renewable energy consumption and oil price shocks on the CA balance of oil-importing economies. The findings suggest that renewable energy shock enhances the CA balance over time, with a notable effect in the third and fourth years. This supports the notion that renewable energy adoption stabilises external balances by reducing dependence on volatile oil imports. Conversely, oil price shocks exert a negative short- to medium-term impact, with the adverse effect peaking within the first two years before gradually diminishing. The results remain consistent when disaggregating economies into CA deficit and surplus panels. The economies with sustained CA deficits experience an immediate positive effect from renewable energy adoption, underscoring its role in mitigating external vulnerabilities. However, these economies remain vulnerable to oil price fluctuations, with adverse effects lasting up to three years. In contrast, surplus economies see a gradual, sustained CA improvement after renewable energy shocks, while oil shock impacts fade within two years. The findings underscore the importance of renewable energy investment in strengthening external stability for oil-importing economies.
Data availability
Data will be made available on request.
Data on renewable energy consumption are available for 1990–2021. However, 2020 and 2021 coincide with the COVID-19 pandemic, which caused unprecedented disruptions to economic activity and energy consumption patterns. Including these years could bias the results. Therefore, we limit our analysis to 1990–2019 to ensure that the findings reflect typical economic and energy consumption behaviour, without distortions associated with the pandemic.