
Introduction
The intensifying economic rivalry between the U.S. and China has deepened the interaction between trade, finance, and politics, affecting global markets. Exchange rates are particularly sensitive to these tensions, as policy changes between the two largest economies generate spillovers. Emerging market currencies are more vulnerable due to their strong trade and investment ties with both countries and their limited capacity to absorb external shocks.
In recent years, the U.S.–China trade war has created persistent uncertainty in currency markets, influencing not only the U.S. dollar and the Chinese yuan but also many emerging market currencies (Luo et al., 2023; Xu & Lien, 2020). Unpredictable trade negotiations, tariffs, and sanctions have increased volatility and complicated decision-making for investors and policymakers (Crowley et al., 2018; Kesse & Blenman, 2024).
Heightened trade policy uncertainty (TPU) affects exchange rates primarily through expectations, trade flows, capital movements, and monetary policy channels. Increased uncertainty raises risk premia, disrupts export and import expectations, and triggers portfolio reallocations toward safe-haven assets, thereby amplifying exchange rate volatility (Huynh et al., 2023; Smales, 2022).
Consistent with these mechanisms, the International Monetary Fund (2025) emphasizes that elevated uncertainty strengthens macro-financial vulnerabilities and intensifies exchange rate fluctuations, particularly in emerging and trade-dependent economies.
Empirical studies show that U.S.–China political tensions and TPU affect both currency markets and international trade. Zeng et al. (2022) find that rising tensions reduced U.S. imports from China and increased exchange rate volatility during the trade war. Similarly, Ongan et al. (2025) report that TPU significantly influences bilateral trade balances, with China responding more strongly to domestic uncertainty. Related empirical evidence further suggests that TPU shocks can trigger disproportionate exchange rate adjustments during periods of elevated global stress, particularly in emerging markets (Khalil & Strobel, 2024; Riaz et al., 2024).
Despite the growing body of literature examining the linkage between exchange rates, U.S.–China tensions, and trade policy uncertainty, important gaps remain. Existing studies largely focus on average effects or specific time periods, thereby overlooking how exchange rate responses vary across market conditions, especially during episodes of heightened stress and uncertainty. Moreover, limited attention has been devoted to the asymmetric behavior of Asian exchange rates, particularly those involving U.S. dollar and Chinese yuan pairs, in response to geopolitical tensions and TPU across different time horizons. This study addresses these gaps by examining how the impact of TPU and geopolitical tensions varies across time scales and distributions, with a particular emphasis on extreme market conditions.
Drawing on the theoretical literature, this study hypothesizes that U.S.–China tensions and TPU exert asymmetric and regime-dependent effects on Asian exchange rates across time horizons and conditional quantiles. This hypothesis is empirically tested using a wavelet quantile regression framework. Accordingly, this research aims to analyze the relationship between Asian exchange rates, U.S.–China tensions, and TPU across multiple frequencies and conditional quantiles. The analysis focuses on asymmetric linkages between U.S.–China geopolitical tensions and exchange rates, particularly U.S. dollar and Chinese yuan pairs in Asian emerging markets. The results indicate that interdependence across currency pairs is asymmetric and highly sensitive to market regimes as well as frequency horizons. Heightened U.S.–China tensions and trade-related uncertainty exert a pronounced impact on Asian currencies. In particular, uncertainty surrounding U.S. trade policy emerges as the most destabilizing factor, while China’s TPU tends to generate more localized effects and, in certain cases, contributes to greater stability across currency markets.
The remainder of the paper is organized as follows: Section II outlines the data and methodology, Section III discusses the empirical findings, and Section IV concludes.
Data and Methodology
A. Data
This study considers monthly data on the U.S.–China tension index, U.S. and Chinese trade policy uncertainty (TPU) indices, and various USD and CNY pairs in Asian emerging markets, including Indonesia, India, the Philippines, Thailand, and Malaysia. The U.S.–China tension index and TPU indices are obtained from policyuncertainty.com, while exchange rate data are sourced from investing.com. The sample period spans from January 2000 to February 2024. All variables are transformed into monthly log-differences.
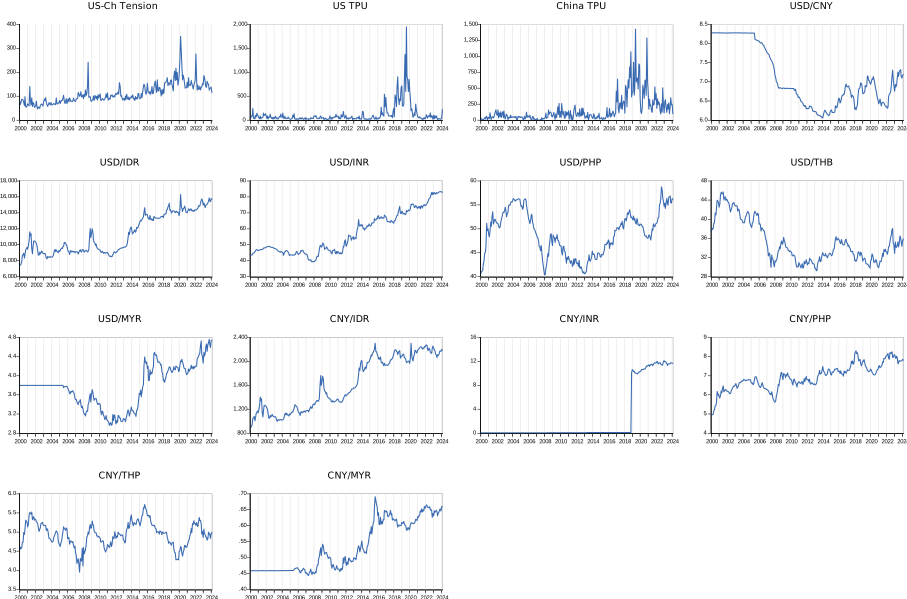
Figure 1 presents the trend of the time series. It shows that Asian exchange rates exhibit clear episodes of heightened volatility and structural shifts during periods of escalating trade tensions between the United States and China. These movements suggest TPU transmits rapidly to foreign exchange markets through expectations of export slowdowns, capital outflows, and risk repricing.
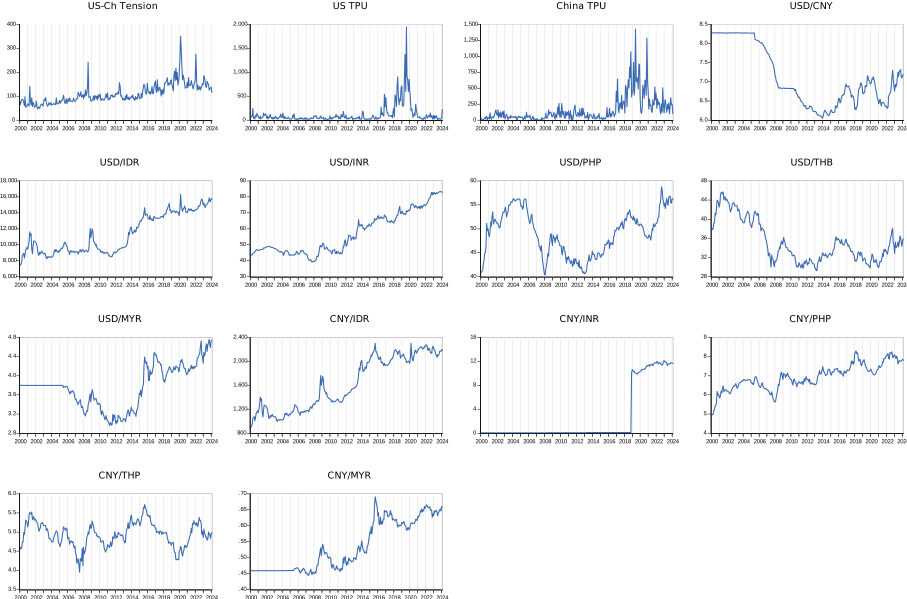
Table 1 presents the descriptive statistics of the variables. All variables show a positive mean, except for USD/CNY and USD/THB. Moreover, the U.S.–China tension index, both TPU indices, and CNY/INR exhibit greater fluctuations and higher standard deviations compared to the remaining variables. Furthermore, the Bai–Perron multiple structural breakpoint test is conducted for all Asian currencies. The results reveal significant break dates that coincide with key episodes of trade tensions between the United States and China, as well as periods of heightened TPU.
B. Methodology
This study utilizes the recently introduced Wavelet Quantile Regression (WQR) method proposed by Adebayo and Özkan (2024), as it enables the analysis of asymmetric and time-varying effects among variables. The WQR results are subsequently estimated at each decomposition level, where the WQR model is defined for a given quantile and at a specific wavelet scale for the dependent and independent variables as follows:
φ(θ)(fj[Y]|fj[X])=y0(θ)+y1(θ)fj[X]
The independent and dependent variables are decomposed using the Maximal Overlapping Discrete Wavelet Transform method.
Main Findings
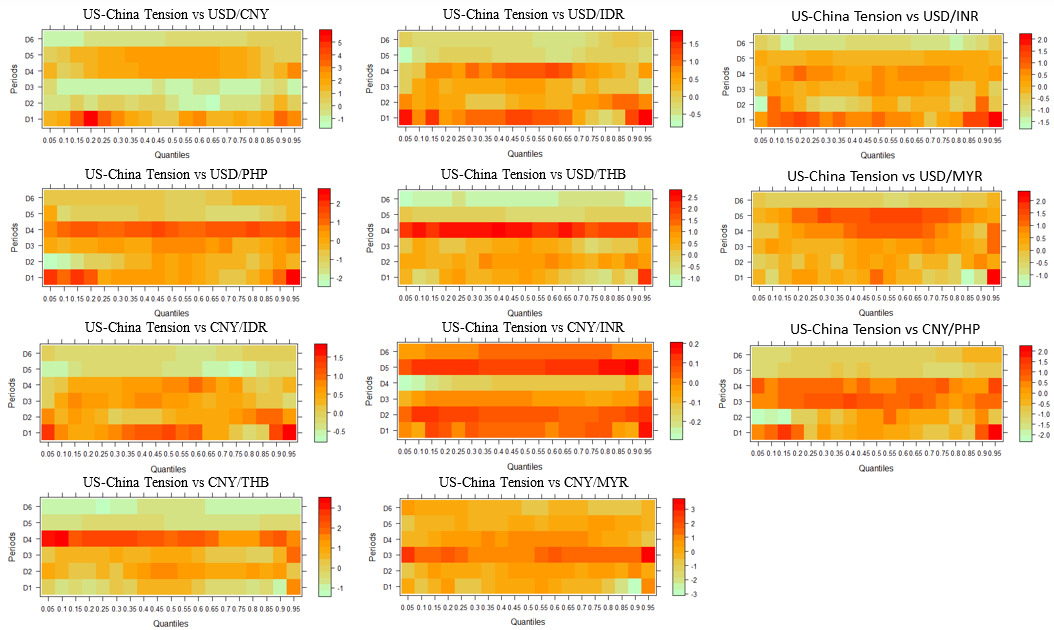
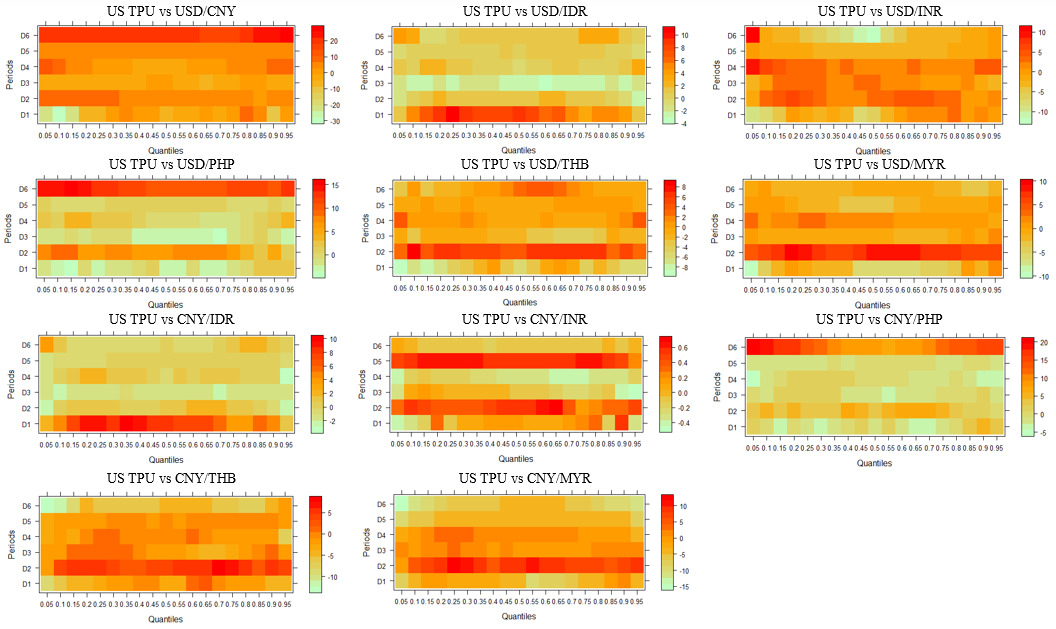
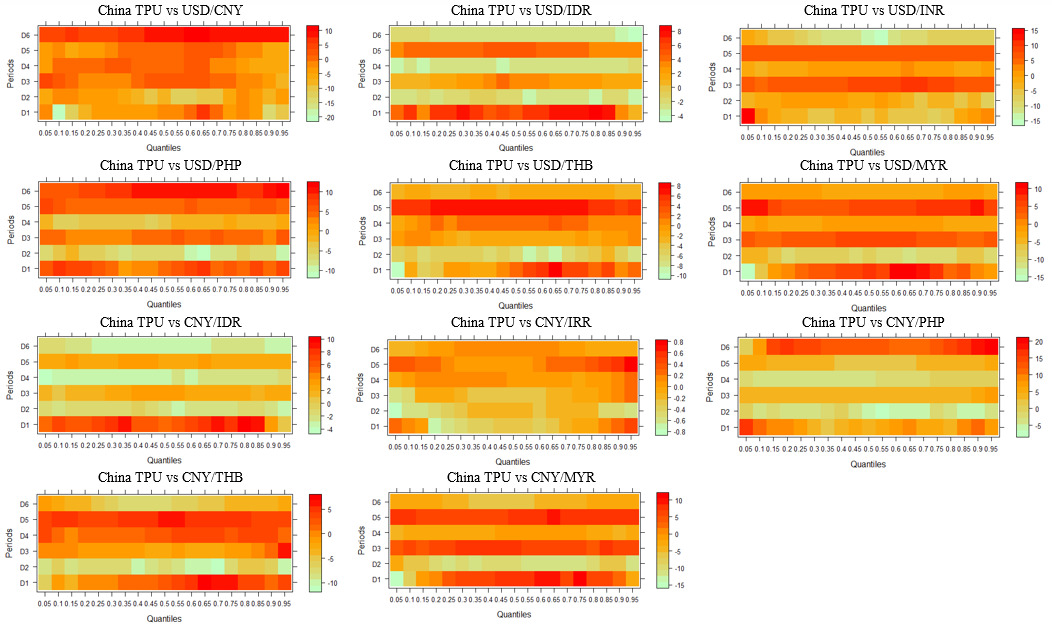
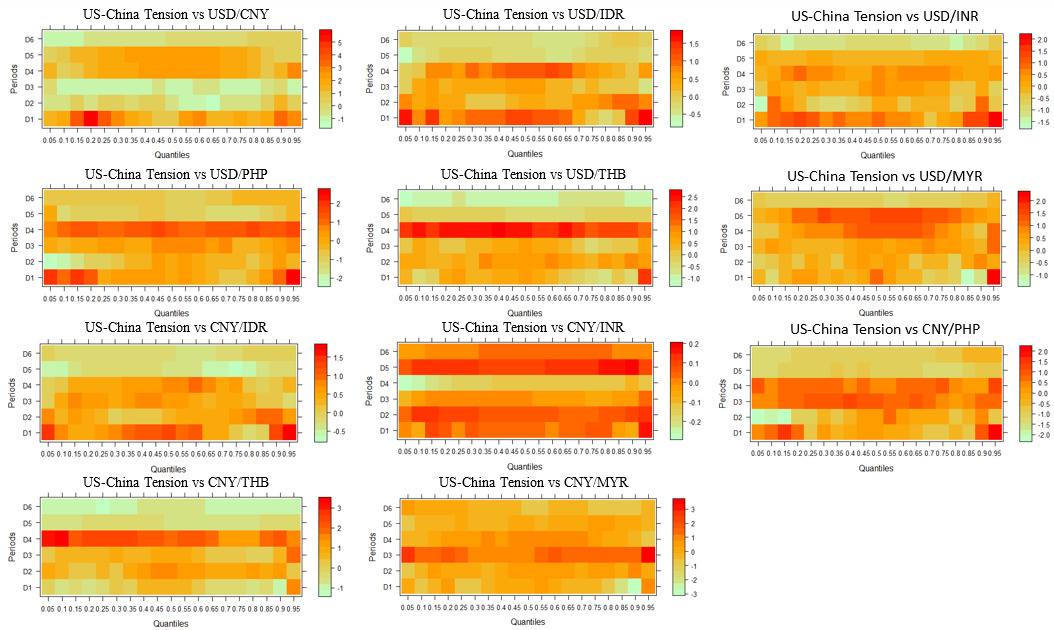
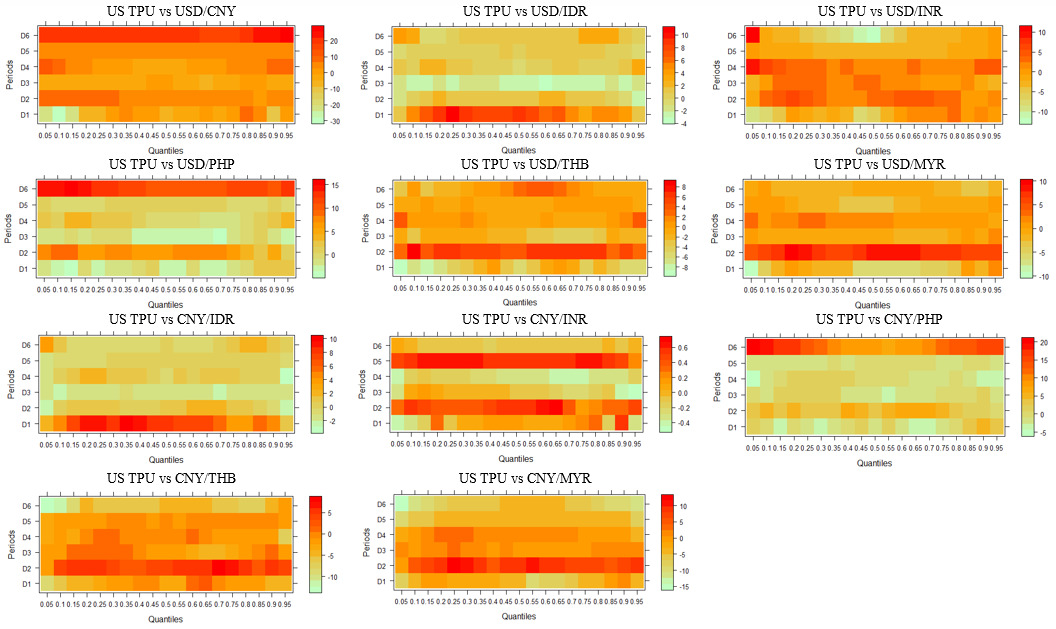
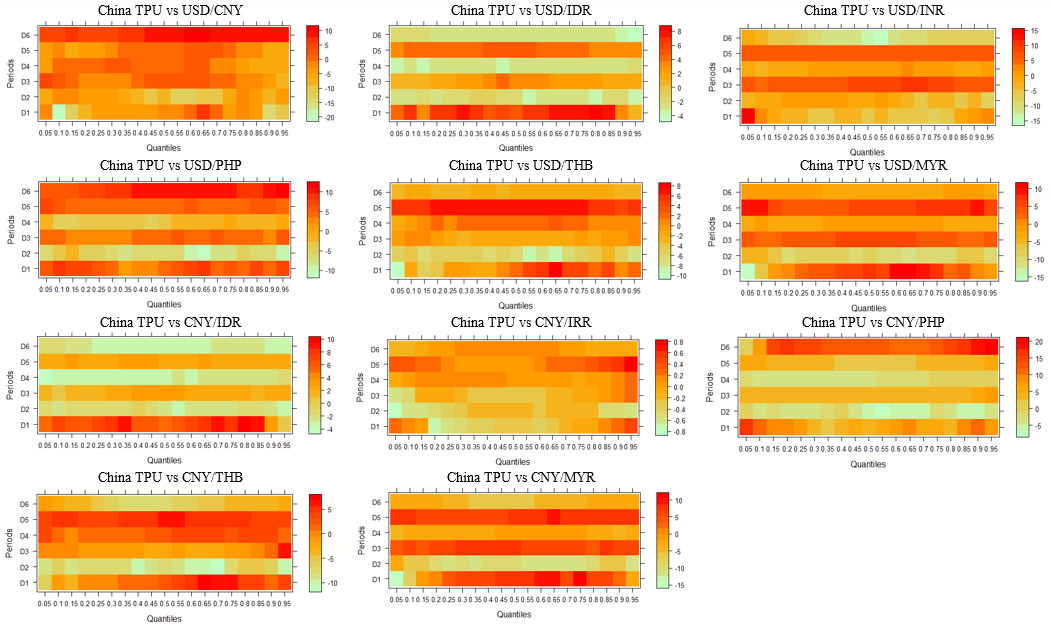
Figures 2 to 4 illustrate dependence patterns across horizons and quantiles using heatmaps, where color gradients represent regression coefficients. Deep red tones indicate strong positive correlations, while green tones denote negative associations. The horizontal axis represents the quantiles, the left vertical axis shows the time horizons, and the scale axis quantifies the magnitude of the dependence.
Figure 2 illustrates the dependence between U.S.–China tensions and exchange rates across different Asian currencies. Overall, most exchange rates exhibit predominantly positive coefficients (orange to red), suggesting that heightened U.S.–China tensions tend to depreciate Asian currencies against both the USD and CNY, with varying intensity across horizons and quantiles. For instance, USD/CNY, USD/MYR, and CNY/THB show strong positive dependence over longer horizons, reflecting heightened sensitivity of these currencies during periods of stress. By contrast, USD/PHP and CNY/PHP display pockets of negative dependence (light green) at certain quantiles, indicating possible hedging or resilience effects. Similarly, CNY/INR shows relatively mild reactions, with coefficients clustering around weaker values. The asymmetry across quantiles suggests that extreme market conditions amplify the effects of geopolitical tension more than median states. Moreover, long-term horizons generally exhibit stronger positive responses compared to short-term dynamics, underscoring the lasting influence of U.S.–China relations on Asian currency markets.
Nonetheless, Figure 3 presents the dependence between U.S. TPU and Asian exchange rates against both the USD and CNY. The results indicate that U.S. TPU exerts heterogeneous impacts on Asian currencies, with most exchange rates exhibiting strong positive dependence (orange to red shades), particularly at higher quantiles and over longer horizons. Notably, USD/CNY, USD/INR, and CNY/PHP display particularly strong sensitivities, with pronounced positive effects in long-term horizons, suggesting that heightened policy uncertainty tends to depreciate these currencies against their counterparts. USD/PHP and USD/THB also show significant positive coefficients, reflecting market vulnerability to U.S. trade shocks. At the same time, certain currencies, such as CNY/INR and CNY/IDR, exhibit occasional green patches, indicating weak or negative effects and implying resilience or counterbalancing dynamics under specific market conditions. The asymmetry across quantiles suggests that the adverse impact of TPU is amplified during extreme market states, underlining the destabilizing role of U.S. trade policies in Asian currency markets.
Additionally, Figure 4 displays the dependence between China’s TPU and a set of Asian exchange rates against both USD and CNY. The results reveal that China’s TPU generally exerts a positive influence on Asian exchange rates, with stronger effects evident at higher quantiles and over longer horizons. Pairs such as USD/CNY, USD/INR, USD/MYR, and CNY/PHP show consistent red tones across mid- to long-term horizons, suggesting that higher Chinese TPU tends to weaken regional currencies against the USD and CNY. Similarly, USD/THB and CNY/THB exhibit noticeable positive dependence, highlighting the vulnerability of Thailand’s currency to Chinese trade shocks. Nonetheless, scattered green patches across pairs such as USD/IDR, CNY/INR, and CNY/THB indicate episodes of negative dependence, particularly in short-term horizons or at lower quantiles, implying that, under certain conditions, China’s TPU may generate stabilizing or hedging effects. Overall, the asymmetric impacts underscore that extreme market conditions amplify the influence of China’s TPU, reinforcing its critical role in shaping Asian exchange rate dynamics.
When comparing the effects of U.S.–China tensions and TPU indices, we find that U.S. TPU exerts a stronger and broader influence on Asian exchange rates than China’s TPU, with USD/CNY, USD/INR, and CNY/PHP showing the most pronounced sensitivity, particularly under extreme market conditions and over long-term horizons. China’s TPU also significantly affects USD/CNY, USD/MYR, and CNY/THB, but its impact is relatively more localized and occasionally stabilizing. Compared with bilateral U.S.–China tensions, which generally produce positive but moderate effects, U.S. TPU emerges as the most destabilizing factor, amplifying currency vulnerabilities, whereas China’s TPU has a more uneven impact. These results highlight the dominant role of U.S. trade policy in shaping regional currency dynamics.
The asymmetric and state-dependent effects can be explained by international finance and open-economy macroeconomic frameworks. Because the U.S. issues the dominant global reserve currency and occupies a central position in the international financial system, increases in U.S. TPU raise global risk aversion and lead investors to shift capital toward safe-haven dollar assets. This process generates stronger and more destabilizing spillovers to Asian currencies. In contrast, China’s TPU mainly affects Asian economies through regional trade and supply-chain linkages, producing more localized effects that may sometimes be stabilized by domestic policy responses. The stronger dependence observed during turbulent periods reflects nonlinear exchange rate dynamics, where uncertainty shocks amplify risk premia and cross-market co-movements.
Institutional quality also plays a key role in maintaining exchange-rate stability. Strong institutions, such as credible central banks, transparent policy frameworks, and effective financial regulation, help anchor expectations and strengthen investor confidence (Stiglitz & Uy, 1996). Consequently, improving governance and institutional frameworks remains essential for enhancing exchange-rate resilience in Asia (Prabheesh et al., 2025).
Conclusion
The main findings of this study reveal that both U.S.–China tensions and TPU significantly influence regional currencies, although their effects differ in magnitude. U.S. TPU exerts the strongest and most widespread destabilizing effects, particularly on USD/CNY, USD/INR, and CNY/PHP, whereas China’s TPU shows more localized and occasionally stabilizing impacts. Geopolitical tensions also contribute to the depreciation of most Asian currencies, with stronger effects observed under extreme market conditions and over longer horizons. These findings offer several policy implications. Asian central banks and policymakers should incorporate geopolitical and trade policy risks into their exchange-rate management frameworks. Building stronger regional financial safety nets and promoting currency cooperation could help mitigate vulnerability to U.S. TPU shocks. Moreover, enhancing the transparency and predictability of trade policies, particularly between the U.S. and China, would reduce uncertainty spillovers and support exchange rate stability in emerging Asian markets.