

I. Introduction
This paper explores whether unemployment rate (UE) rises when fewer tourists travel to Hong Kong. Our hypothesis is that tourist arrivals (TA) and UE move in opposite directions. The proposed relationship between tourism and unemployment is derived from the Okun’s law. This hypothesis test is important because there is a close association between the tourism industry and the labour market in Hong Kong. Our proposed hypothesis test can potentially offer lessons to policy makers.
As a special administrative region of China, Hong Kong’s tourism has developed into one of the four pillar industries, which have significant influence on the country’s employment situation (Fu et al., 2020). In addition, tourists from Chinese mainland accounted for 78.29% of the total number of visitors to Hong Kong in 2019. It follows that UE may increase due to the decline in TA from Chinese mainland and vice versa. This view is supported by the outbreak of Severe Acute Respiratory Syndrome (SARS) in 2003, the central movements in 2014, and the violence in 2019. Furthermore, the events in other countries or regions also have significant effects on TA and UE. The geopolitical risks, such as the 9/11 terrorist attacks, create global panic (Su, Khan, et al., 2019), which not only reduces public demand for travel to the U.S. but also to Hong Kong, leading TA and UE to move in different directions. In addition, a similar pattern in travel demand can be observed from previous economic crises, such as the Asia financial and the global finance crises.
The relationship between the tourism industry and the labour market in Hong Kong has attracted worldwide attention over the past decades. Chao et al. (2009) ascertain that the rise in TA decreases UE. Jin (2011) reveals that there is a positive short-run influence from TA to economic growth in Hong Kong. Fu et al. (2020) point out that tourism development in Hong Kong may negatively affect UE, which is related to the quality of life among residents. The existing studies mainly investigate a one-way effect from TA to UE, but a one-way test only tells a partial story of the relation between TA and UE. In addition, the relationship between TA and UE maybe unstable–an aspect of the relationship ignored by the literature. Our goal is to attend to both the bi-directional and the unstable nature of the relation between TA and UE. We examine the non-constant parameters in the empirical model by considering monthly data from January 2001 to December 2019. We use the bootstrap sub-sample rolling-window causality test to improve the accuracy of our hypothesis test. We are able to gauge any evidence of instability in the relation by obtaining the time-varying interaction between TA and UE. The results indicate that there is causal relationship between TA and UE in Hong Kong during certain periods.
The rest of the paper is arranged as follows: Section II explains the empirical methods. Section III reveals the empirical results. Section IV summarizes the paper.
II. Methodology and Data
A. Methodology
According to the traditional vector autoregression (VAR) model, the Granger causality test statistics must obey the standard normal distributions. In order to avoid the incorrect outcomes and improve the correctness of the causality, we examine the mutual influences between TA and UE through estimating the residual-based (RB) modified-LR (likelihood ratio) statistics. Since exchange rates have certain effects on tourism and labour markets, we choose the exchange rate of the Hong Kong dollar to Renminbi (HKD) as a control variable.[1] The VAR system can be written as Equation (1):
[TAtUEt]=[α10α20]+[α11(L)α12(L)α13(L)α21(L)α22(L)α23(L)][TAtUEtHKDt]+[ϑ1tϑ2t](1)
where is a white-noise process; where L is a lag operator, and The null hypothesis that UE cannot affect TA is represented by The null hypothesis that there is no effect from TA to UE is represented by
Equation (1) assumes that the VAR system only has constant parameters, which is not always the case. We, therefore, employ parameter stability tests, including Sup-F, Ave-F and Exp-F tests developed by Andrews (1993) and Andrews & Ploberger (1994), as well as the test developed by Nyblom (1989) and Hansen (1992). If there are structural breaks, we ought to apply the bootstrap sub-sample rolling-window causality test to investigate the mutual influences between these two variables. Balcilar et al. (2010) develop this sub-sample method in order to split the whole sequence into multiple sections according to the rolling-window width.[2] The separated sections can obtain causal relationships through applying the RB-based modified-LR statistics. Next, the outcomes of the rolling-window test can be obtained. and capture the impact from UE to TA and the effect of TA on UE, respectively, where is the number of times of bootstrap iterations. In addition, we apply the 90% confidence interval with the relevant lower (5th quantile) and upper (95th quantile) limits (Su, Qin, Tao, & Umar, 2020; Su, Qin, Tao, Shao, et al., 2020; Su, Wang, et al., 2019).
B. Data
We consider monthly data from 2001:M1 to 2019:M12 to explore the Granger causality relationship between TA and UE. The TA data are obtained from the Hong Kong Tourism Board while the UE data are obtained from the Census and Statistics Department. Moreover, we perform the X-12 seasonal adjustment method to eliminate any seasonal effects from these two variables. This is important as it obviates any bias resulting from seasonally non-adjusted data. Since tourism activity in Hong Kong is largely created by tourists from mainland China, we choose the exchange rate of HKD as a control variable, which is taken from the Hong Kong Monetary Authority. Also, these three variables are taken in natural logarithm form and their first differences as per time-series modelling pre-requisites.
III. Empirical Results
We choose the optimal lag order of 2 based on the Schwarz information criterion (SIC) to perform the full-sample test. Table 1 reports the results. The p-values point out that there is an influence from TA to UE at a 1% level, while UE cannot significantly affect TA. We employ the parameter stability tests to further explore the robustness of the full-sample results. Through the parameter stability tests, we can conclude that there is a non-stable interrelationship between TA and UE. We then apply the rolling-window test to investigate the non-constant interaction between these two variables. We also choose the rolling-window width as 24 months in order to ensure the accuracy of the Granger causality relationship analysis.[3]
Figure 1 highlights the p-values and the direction of the influences of TA on UE. We find that TA Granger causes UE during the periods of 2003:M5-2004:M11, 2010:M10-2011:M1 and 2019:M10-2019:M12 at the 10% significance level and there are negative effects during these three periods.
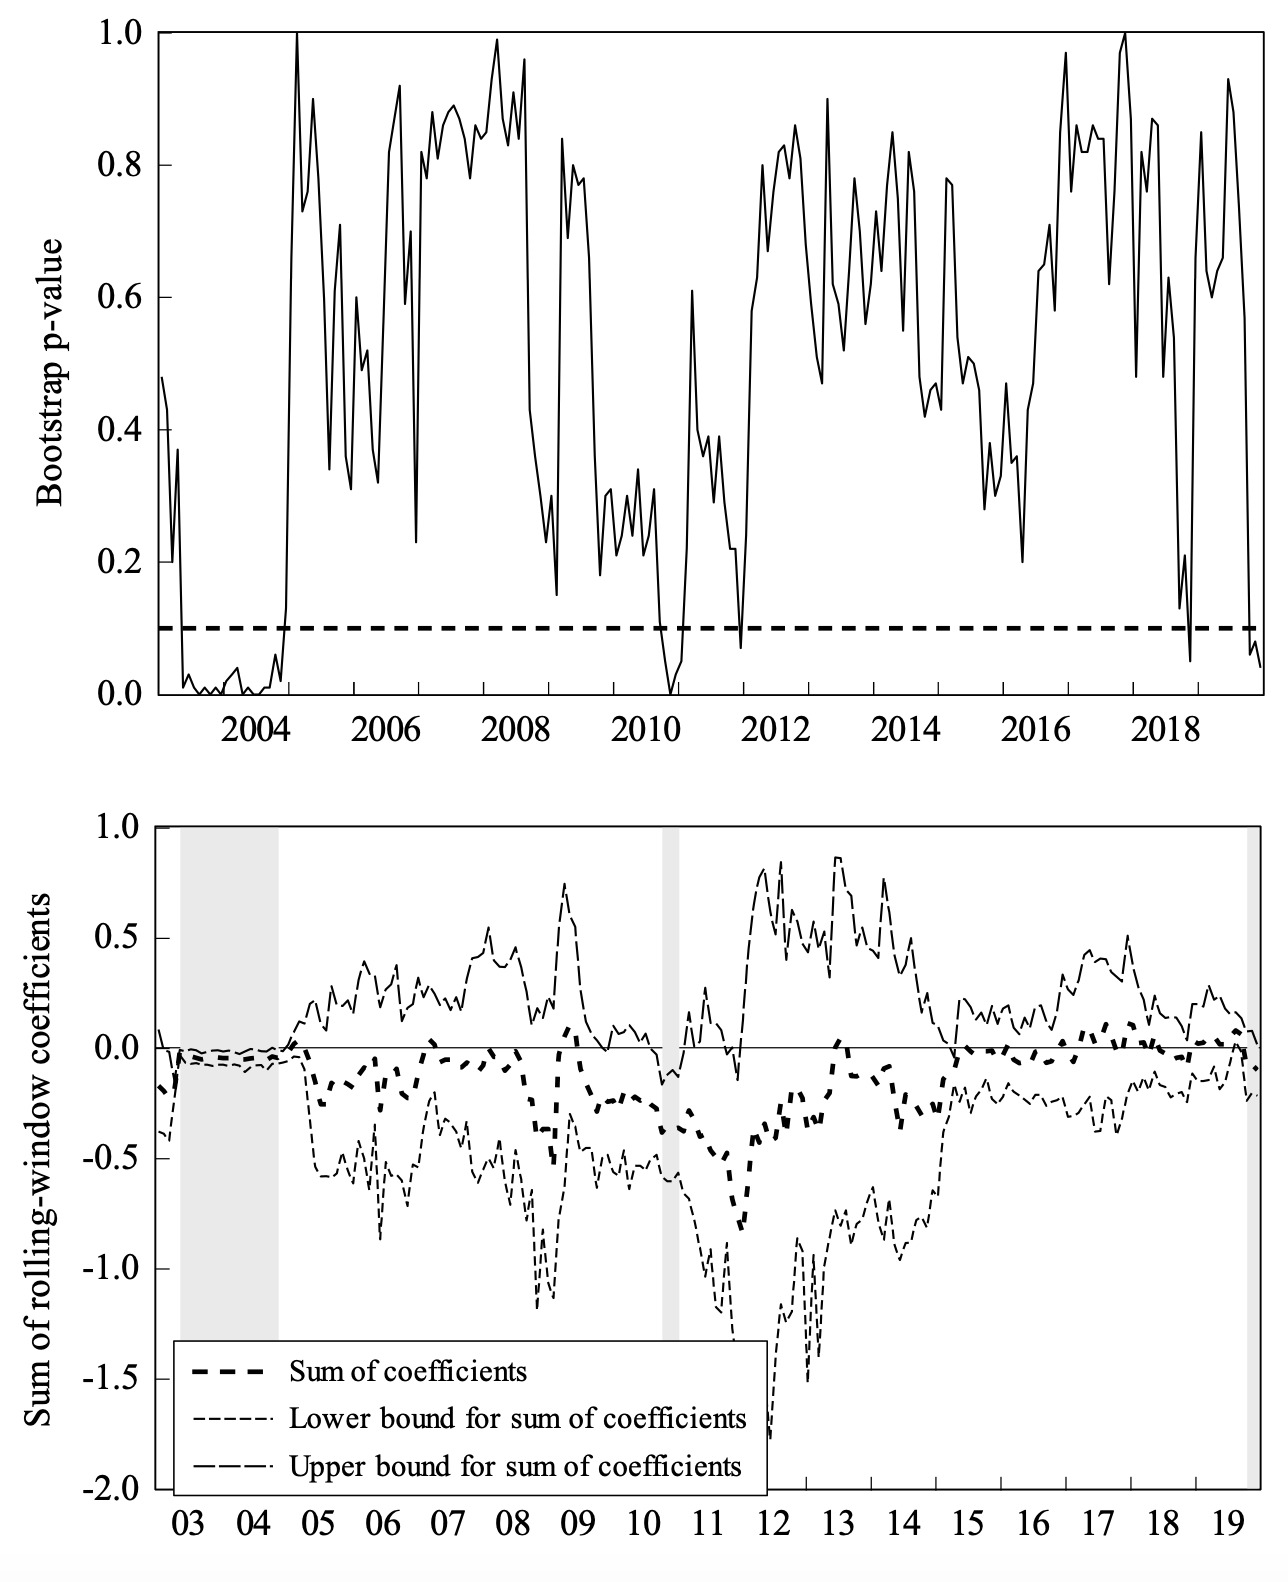
The outbreak of SARS in 2003 spread to the world and this infectious disease also severely affected Hong Kong. On April 2, 2003, the World Health Organization (WHO) issued a travel warning, discouraging unnecessary travels to Hong Kong. As a result, TA had decreased since the outbreak of SARS, and there are three ways to explain the negative influence on UE. Firstly, the demand for labour in tourism-related industries experienced a significant reduction causing UE to increase. Secondly, the decrease in TA led to a sharp decline in purchasing power, which reduced the demand for employees. Thirdly, in order to prevent the continued spread of SARS, a large number of enterprises stopped production and shutdown, which further increased UE. As the infectious disease subsided, the WHO revoked the travel warning to Hong Kong on May 23, 2003. In addition, a completely open tourism policy was gradually implemented by the Hong Kong government for tourists in mainland China since July 2003. All of these drove TA, resulting in a fall in UE.
The rise in TA during the period of 2010:M10-2011:M1 can be explained from three aspects. Firstly, the global economic crisis had subsided, and income growth increased tourism demand for Hong Kong. Secondly, the end of Hemagglutinin-1 Neuraminidase-1 (H1N1) influenza pandemic made tourism from mainland China to Hong Kong more attractive. Thirdly, the Hong Kong Tourism Board launched the “2010 Hong Kong Festival Year” to attract tourists from around the world. Thus, there is an increase in TA, which negatively affects UE. High TA leads to the development of tourism and related industries which improved job prospects, thus causing a decline in UE.
The peaceful demonstrations in Hong Kong that began in June 2019 have repeatedly turned into violent conflicts. The violent behaviours have escalated and the panic has spread. As a result, there has been a large-scale reduction in tour groups, and several major international events have announced cancellation of their Hong Kong’s itinerary. A significant decline in tourists to Hong Kong particularly from mainland China has been experienced: TA from China have decreased by nearly 40% from June to December 2019. The decline in TA has reduced labour demand in the tourism industry. Consumption levels and purchasing power have fallen sharply. There has been a rise in UE. The above results are supported by Okun’s law, which highlights a negative interrelationship between TA and UE.
Figure 2 underlines the p-values and the direction of the impacts of UE on TA. UE positively influences TA during the December 2015 to November 2016 period. UE follows an upward trend during this period, which is mainly due to three reasons. To begin with, the stock and real estate markets have not improved as per expectations. Slowdown in tourism has also impacted negatively the construction industry. In order to decrease UE, related authorities have implemented several measures to promote the development of the tourism industry. Therefore, the positive influence of UE on TA during the period of 2015:M12-2016:M11 can be evidenced, which is inconsistent with Okun’s law.

IV. Conclusion
This paper investigates the time-varying interaction between tourist arrivals (TA) and unemployment rate (UE) in Hong Kong using monthly time-series data fitted to a VAR model. We find that TA negatively influence UE, implying that lack of tourism hurts employment prospects. We also document a positive influence on TA from UE, indicating that unemployment stimulates related authorities to promote tourism.
Acknowledgement
The authors are grateful to the Editor and an anonymous referee for helpful comments/suggestions, which have improved the quality of this paper. Any errors/omissions, if found, are the responsibility of the authors.
In addition, we choose the economic policy uncertainty (EPU) index and geopolitical risk (GPR) index for Hong Kong as control variables.The results are consistent with those obtained when using HKD as a control variable. The EPUand GPR indexes for Hong Kong are taken from the EPU database.
Pesaran & Timmermann (2005) ascertain that this width cannot be less than 20 when there are time-varying estimations and causal relationship.
We choose the widths of 20, 28 and 32 months to ensure the robustness of the conclusions We find consistent results.