I. Introduction
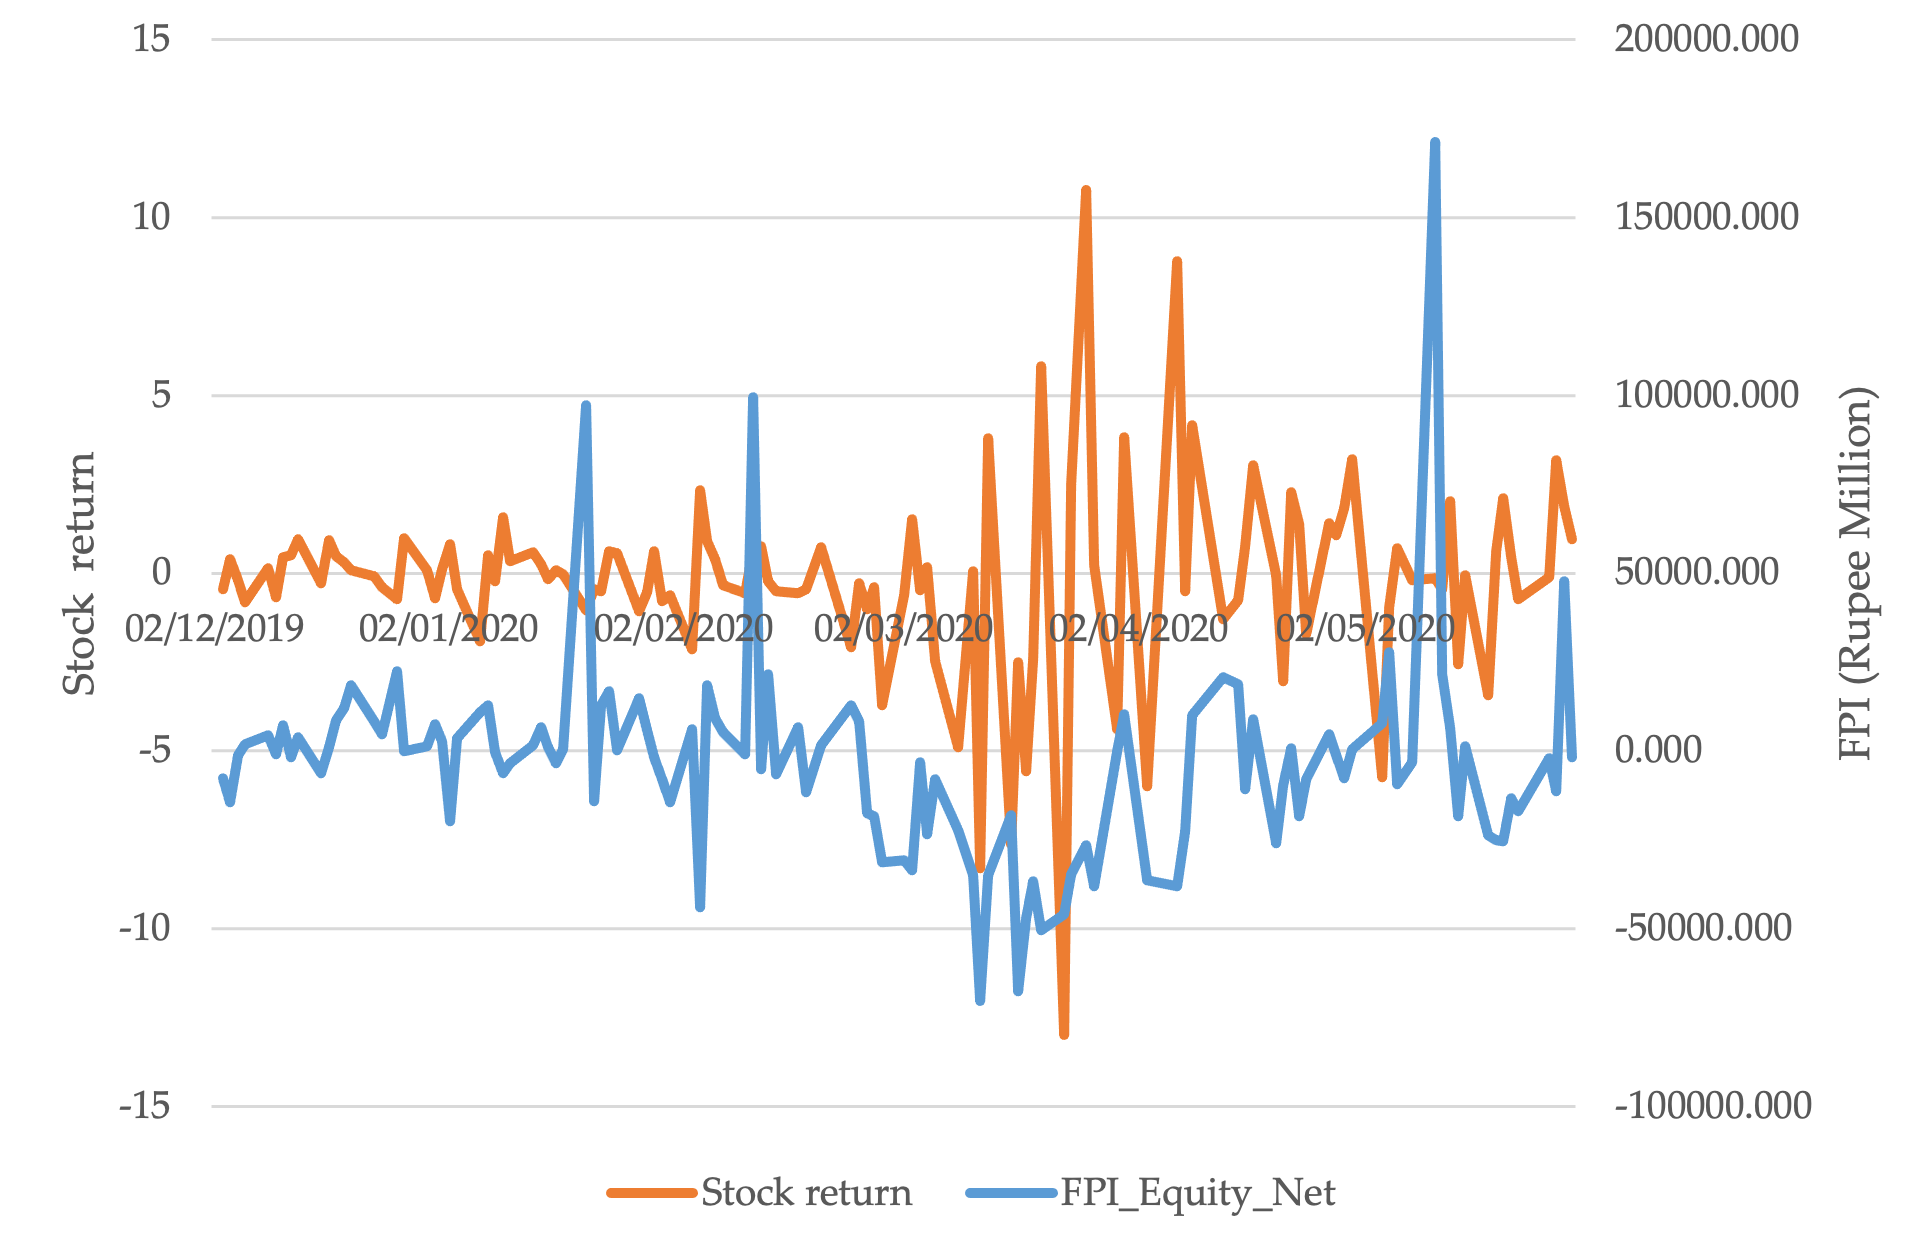
The global capital flows play an important role in driving financial markets of emerging market economies (EMEs). The financial integration and consequent cross-border capital flows have accentuated the relation between global capital flows and stock returns in EMEs (Henry, 2000). Further, Rey (2015) states that asset prices in EMEs are more sensitive to global market conditions than domestic policy changes. The recent COVID-19 pandemic outbreak increased the overall global risk, and thus EMEs experienced the sharpest reversal of portfolio flows on record, valued at over $100 billion within a month (IMF, 2020). This adversely affected the stock market performance of these economies. Figure 1, for instance, shows the trends in foreign portfolio investment (FPI) in India together with stock market returns. It can be observed that the co-movement of these two are strong during March 2020, the period marked by the COVID-19 outbreak, which implies that the global risk condition increased the dynamics of foreign capital flows and stock market returns during the pandemic for India. However, existing studies on COVID-19 do not give attention to the impact of FPI on the stock markets of the EMEs. The present study examines the causal relationship between FPI flows and stock market returns in India.

As per the theory and empirical evidence, opening a stock market to foreign investors is beneficial for an economy. Errunza & Losq (1985), for instance, show that removing capital barriers reduces the cost of capital in a developing economy to global levels—a finding consistent with the classic international asset pricing models. Similarly, it is argued that foreign investors possess superior information, which has a positive effect on valuation (Bekaert & Harvey, 2000). In the context of emerging economies, the evidence on how FPI impacts the stock market is mixed. For instance, FPI is found to have a positive effect on market returns, and foreign investors follow positive feedback effect trading strategy in these economies, i.e., buy after stock prices increase and sell after stock prices decline (Jeon & Moffett, 2010). On the other hand, the reversal of FPI flows adversely affects emerging stock markets (Singh & Weisse, 1998) and short-term speculative behavior of the foreign investors destabilizes the stock market during the financial crisis through sudden withdrawals (Kim & Wei, 2002).
In the Indian context, it is found that FPI flows are driven by the higher stock returns in the country (Gupta & Gordon, 2003; Rai & Bhanumurthy, 2004), and a unidirectional causality runs from stock returns to FPI flows (Mukherjee et al., 2002). On the other hand, the findings from Babu & Prabheesh (2008) suggest a bidirectional causality. The existing literature on the impact of COVID-19 is evolving. The literature has found that the pandemic adversely impacts economic growth and trade (Vidya & Prabheesh, 2020) and stock markets (Ertuğrul et al., 2020; Haroon & Rizvi, 2020; He et al., 2020; Huang & Zheng, 2020; Iyke, 2020; Phan & Narayan, 2020; Prabheesh, Garg, et al., 2020; and Prabheesh, Padhan, et al., 2020). However, no specific study examines the FPI and stock market returns relationship during the COVID-19 pandemic. Thus, the present study aims to fill this research gap.
The rest of the article is organized as follows. Section II deals with the data and methodology. Section III reports the empirical results. Section IV concludes.
II. Data and Methodology
We use daily data for the S&P CNX Nifty, which is the index of the National Stock Exchange, comprised of 50 stocks from 24 sectors of the Indian economy. We also obtain daily data on aggregate net foreign portfolio inflows. All data are for the period January 2, 2019 to September 30, 2020 and are obtained from the China Economic Information Center. The FPI flows are measured in Indian rupees (crore). Daily stock returns are calculated as *100, where and denote daily return and price, respectively.
The dynamics of the FPI and stock market returns are analysed using the Modified Wald (MWALD) Granger causality test proposed by Toda & Yamamoto (1995). The inference of the null hypothesis follows a distribution and uses m degrees of freedom, instead of The following system equations is estimated to analyse the causality between FPI and stock market returns.
In these equations, in addition to and which have been defined previously, ε is the serially uncorrelated random error term; m is the optimal lag length; and is the maximum order of integration. The statistical significance of indicates that causality runs from FPI to stock market returns, whereas the statistical significance of denotes causality running from stock market returns to FPI.
III. Empirical findings
Table 1 contains the Narayan & Popp (2010) unit root test results. The findings are: is stationary at levels in all sample periods. On the other hand, is stationary only in levels in the full sample and non-stationary in the pre-COVID-19 and COVID-19 periods. The implication is that the integration order of variables is mixed for COVID-19 and pre-COVID-19 sample periods. Hence, in the subsequent analysis the maximum order of integration is treated as 1 After identifying the maximum order of integration, the appropriate lag length should be chosen. As per the Akaike information criterion and Schwarz information criterion, the lag length of 5 is chosen. At this lag length the VAR is autocorrelation free and is stable. Table 2 contains associated results. It can be observed that the null hypothesis that FPI does not Granger cause stock market returns and vice versa cannot be rejected during the pre-COVID-19 period, implying no causal relation between the two variables. During the COVID period, however, the null hypothesis that FPI does not cause stock market returns is rejected, indicating that FPI improves predictability of stock market returns. This indicates that the FPI withdrawal during the COVID-19 outbreak led to a significant decline of the Indian stock market. In the case of the full sample period, the same finding is also observed.
IV. Conclusions
This paper examines the causal relationship between FPI flows and stock market returns for India during the COVID-19 period. The empirical findings suggest a unidirectional causality running from FPI to stock market returns during the COVID-19 period. During the pre-COVID-19 period, no causality relationship is observed. Our findings suggest that the Indian stock market movement is highly exposed to the volatile nature of the FPI during financial instability, suggesting that policy should focus on improving the soundness of the financial sector.