
I. Introduction
This paper examines the impact of COVID-19 on EPU in Asia. We consider five Asian economies that have data on EPU indexes, namely China, India, Japan, Korea, and Singapore. Besides, India, Japan, Korea, and Singapore are leading economies in Asia and are also closest to China, where the first COVID-19 case was recorded, according the World Health Organization.[1] Collectively, China, Korea, and Singapore are becoming global economic powerhouses, the so-called Asian Tigers (Iyke & Ho, 2020). Similarly, Japan is the first industrialized Asian country (see Iyke & Ho, 2020), while India remains a global economic ‘sleeping giant’ expected to experience the next wave of industrialization after China (see Wood & Calandrino, 2000). Most manufacturing activities are now located in these countries.[2] Hence, rising uncertainties in these countries would not only disrupt economic activities there but also in the rest of world via the ever-interconnected global supply chains. The supply shock in China in February 2020 triggered a global demand shock due to the shutdown policies that followed the COVID-19 outbreak and underscored the frailties of the global production and supply chains.[3] Similarly, the COVID-19 outbreak caused a substantial reduction in trade interconnectedness globally following the COVID-19 outbreak, clearly showing a negative shock to global trade.[4] Therefore, considering the growing global importance of the Asian economies, understanding how their economic policies are influenced by extreme events like COVID-19 is critical to policymakers around the world in their search for resilient policies to limit negative international shock spillovers.
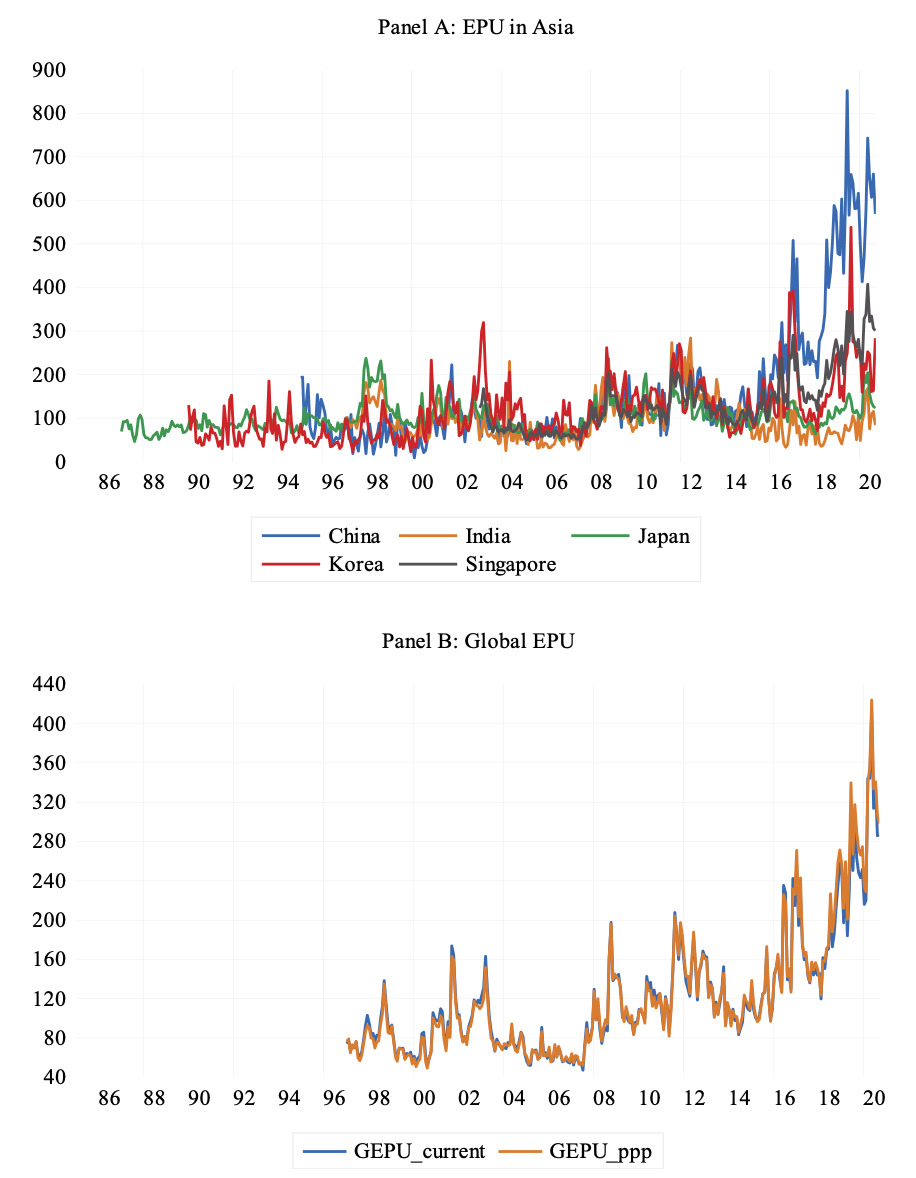
The COVID-19 outbreak caught everyone by surprise. The pandemic has been devastating, in terms of contagiousness and fatality, and brought economies to a halt (see Phan & Narayan, 2020). The pandemic led to unprecedented policy responses—lockdowns, social distancing, and stimulus packages—across the globe (Iyke, 2020b). The uncertainty surrounding these policy responses is huge because policymakers and other economic agents are not certain whether the responses will be temporary or permanent, to what extent the interventions will influence investment and consumption activities, how long economies will take to recover, among others (see Altig et al., 2020). Panel A of Figure 1 shows that, other than Japan and India, the EPU indexes in the Asian countries experienced extreme upward swings during the COVID-19 pandemic. To put things in perspective, Panel B of Figure 1 shows that global economic policies have never been as uncertain as they presently are—not even the global financial crisis of 2007–2009 was able to induce this level of uncertainty. We find strong empirical support that the pandemic induced EPU upwards in China and Korea but less so in the other countries. For Japan and India, we find consistent evidence that COVID-19 has no impact on EPU, reflecting the observed moderate patterns of these countries’ EPU indexes in Figure 1. We show that our estimates are robust across specifications and measures of the COVID-19 pandemic.
A growing body of literature demonstrates that the COVID-19 pandemic affected different facets of economies (Sha & Sharma, 2020). This literature can be distilled along several lines, including those showing that the pandemic impacted: corporate outcomes, such as liquidity and cash-holdings (Fu & Shen, 2020); stock markets (Haroon & Rizvi, 2020; Salisu & Sikiru, 2020); oil markets (Devpura & Narayan, 2020; Iyke, 2020a; Narayan, 2020b; Prabheesh et al., 2020); foreign exchange markets (Iyke, 2020b; Narayan, 2020a); global trade and insurance markets (Vidya & Prabheesh, 2020; Wang et al., 2020); and global politics (Apergis & Apergis, 2020), among others.
We contribute to the literature by showing that the pandemic also affected EPU. Our exploit is related to Altig et al. (2020), who find a huge surge in economic uncertainty indicators in the UK and the US during the pandemic. Our study differs from theirs because we focus on Asian economies and measure the actual rather than the implied impact of the pandemic on EPU via regression analysis. In other words, we regressed EPU on various COVID-19 measures to estimate the impact of the pandemic on uncertainty.
II. RESULTS
Our analysis uses the maximum available monthly data on EPU for each country. The sample periods are: 1995M01–2020M09 (China); 1997M01–2020M09 (India); 1987M01–2020M09 (Japan); 1990M01–2020M09 (Korea); and 2003M02–2020M09 (Singapore). We use monthly data because the EPU data is available up to monthly frequency. We access the EPU data at www.policyuncertainty.com. We measure the COVID-19 pandemic using a dummy variable, which assigns a value of zero to months before March 2020 and a value of one from March 2020. On 11th March 2020, the World Health Organization declared COVID-19 as a pandemic (see Phan & Narayan, 2020). Hence, March 2020 is chosen to coincide with this declaration. We use a dummy variable to measure the pandemic in order to have sufficient observations for our estimations, since the EPU data are available in monthly but not daily frequencies.
Table 1 shows three different regression estimates of the impact of COVID-19 on EPU. We use the heteroskedastic and autocorrelation consistent standard error structure throughout our analysis. Clearly, the pandemic has a positive and significant impact on EPU in China, Korea, and Singapore, reading the estimates in Panel A. Allowing further lags of EPU in our specification, as in Panel B, the impact of COVID-19 on EPU in China and Korea remains positive and statistically significant. Similarly, allowing further lags of EPU and considering the past instead of contemporaneous impact of COVID-19, we find the pandemic to retain its positive and significant coefficient for China and Korea.
We subject these estimates to robustness checks but do not report these results due to space consideration. In these robustness checks, we regress EPU on its first lag and one of two measures of the COVID-19 pandemic, namely the total COVID-19 cases and deaths per million people.[5] Data on these two COVID-19 measures are available at a daily frequency from 12/31/2019 to 9/01/2020. However, since EPU data is only available at monthly frequency and since the time span of the COVID-19 data is too short when considered at monthly frequency, we convert the EPU data to daily frequency using the linear interpolation method. This introduces measurements errors in our EPU data. Hence, we recommend that estimates based on this data should be cautiously interpreted. The estimates based on the total COVID-19 cases per million people suggest that the pandemic positively induces EPU in China and Korea, consistent with the main estimates. Using the total COVID-19 deaths per million people, we find that the pandemic positively induces EPU in China. Although the impact of the pandemic on EPU is positive in Korea, it is not statistically significant. Overall, we find our estimates to be robust to different measures of the COVID-19 pandemic.
Our finding of a pandemic-induced economic uncertainty in China and Korea echoes the observations that the unprecedented nature of the COVID-19 outbreak spearheaded equally unprecedented policy responses (Iyke, 2020b; Phan & Narayan, 2020), whose paths and impacts are uncertain (Altig et al., 2020). Our conclusion is in line with Altig et al. (2020), who find, using the UK and the US data, that the implied economic uncertainty of the COVID-19 shock is large.
III. CONCLUSION
We examine the impact of the COVID-19 pandemic on EPU in Asian countries. We consider five leading Asian economies (China, India, Japan, Korea, and Singapore) for which data on EPU are available. Our regression estimates suggest that the COVID-19 outbreak has a positive and statistically significant impact on EPU in China and Korea. This finding survives robustness checks. Although we do not find evidence that the pandemic induced economic uncertainty in India, Japan, and Singapore, the visibly high levels of the EPU indexes in 2020 cannot be a mere coincidence. These high EPU levels have implications for the Asian economies in terms of their policy initiatives and implementations. Consumers and firms may be less optimistic, and this will show in reductions in consumption, investment, employment, and production, among others. Therefore, policymakers should continue pursuing expansionary policies to prevent substantial reduction in economic activities, while implementing safety measures to minimize the spread of the virus.
See https://www.who.int/news/item/27-04-2020-who-timeline—covid-19.
See https://hbr.org/2020/09/global-supply-chains-in-a-post-pandemic-world.
See Vidya & Prabheesh (2020) for a discussion.
We access this data at https://ourworldindata.org/coronavirus.