I. Introduction
The literature has shown the relevance of exchange rates for asset prices, particularly during the COVID-19 period. P. K. Narayan et al. (2020), for instance, show that the Yen exchange rate predicts Japanese stock returns. P. K. Narayan (2020b) show that the Yen has become more resilient to shocks during the COVID-19 period. P. K. Narayan (2020a) shows that bubble activity in the Yen exchange rate has intensified in the COVID-19 period, rendering the market more inefficient. Moreover, Iyke (2020) shows that COVID-19 virus cases predict exchange rates. Over the COVID-19 period, oil prices have become over 900% more volatile (see Devpura & Narayan, 2020). Given this literature, we argue that oil price is also a shock to exchange rates given that oil prices have been shown to influence exchange rates and there are multiple theories that support such a relationship, such as the terms of trade channel (see Amano & Van Norden, 1998) and the wealth channel (see Krugman, 1983); for a survey of relevant theories, see Beckmann et al. (2020). For empirical studies on oil price shocks and exchange rates, see, inter alia, Jiang et al. (2020), Nusair & Olson (2019), and Jung et al. (2020).[1]
In this paper, we examine whether the West Texas Intermediate (WTI) 1-month oil futures price predicts Japanese Yen. Our hypothesis is that the predictability relationship –that is, the ability of oil prices to predict exchange rates would have become stronger in the COVID-19 period because the Yen has become: (a) more resilient to shocks as demonstrated in the work of P. K. Narayan (2020b); and (b) has seen bubble activity intensify (P. K. Narayan, 2020a). For this reason, given the evolving literature on the Japanese market, in this study we focus on Japan. For the Japanese Yen, we choose the U.S. (United States) dollar as a basis because the WTI oil futures price is expressed in U.S. dollars. Our choice of WTI 1-month oil futures price is mainly because futures are used as a derivative contract to hedge against any risk or uncertainty.
Our approach to testing the proposed hypothesis is to employ a time-varying predictability model. That our dataset is high frequency aids our approach and hypothesis test. Hourly data span 17 hours per day and cover the period 01/07/2019 to 04/09/2020. Our in-sample predictability setup is based on using the first 50% of the sample as the first estimation window and continue recursive estimation by expanding the window by an hour thereafter until the sample is exhausted. In order to depict any predictability relationship emanating from COVID-19, we divide the main sample into two sub-samples, namely, a pre-COVID-19 period (01/07/2019 to 30/12/2019) and a COVID-19 sub-sample (from 31/12/2019 to 04/09/2020).[2]
The main findings are; first, the oil price has predictive ability for Japanese Yen but the evidence is limited. Our results indicate that, for the full sample, the oil price predicts Yen only about 6% of the time. Hence, we do not find evidence that Yen predictability is time-varying. Second, with regards to the direction of the relationship, we discover the negative relationship is dominant overall, particularly during the COVID-19 sample. We evaluate the sensitivity of our results to the in-sample window choice by setting it to 25% of the data. We obtain consistent results regarding the direction of the negative relationship.
This paper contributes to the literature in the following way. Post-COVID-19, the Japanese Yen has received most attention from an exchange rate evolution and behavior points of view, as reviewed earlier. We add to these studies by showing that the evolution of the Yen in the COVID-19 period has little to do with the oil price, which has traditionally been regarded as a predictor of exchange rates.
The research paper is organized as follows. Section II explains our data and methodology. Section III presents and discusses results. Finally, we present concluding remarks in Section IV.
II. Data and Methodology
We have Japanese Yen against the US dollar as the exchange rate variable and the WTI 1-month oil futures price as a proxy for oil price (oil). The data are 17-hour per day, from 01:00am to 17:00pm. The time frame is from 01/07/2019 to 04/09/2020. The data include the COVID-19 period: we divide the main sample into two sub-samples, namely the pre-COVID-19 period (01/07/2019 to 30/12/2019) and the COVID-19 sub-sample period (31/12/2019 to 04/09/2020).
We calculate the natural log percentage returns of the Yen as:
We employ the Westerlund and Narayan (2012, 2015) predictive regression model that examines the null hypothesis of no predictability, as follows:
In this regression, we include in order to control for persistency and endogeneity of the oil variable, and is the disturbance term. In order to control for heteroskedasticity, we divide each variable by its corresponding standard deviation. Finally, the coefficients are estimated using the Ordinary Least Squares method.
III. Discussion of Results
In this section, we elaborate on the descriptive statistics followed by the time-varying results from Equation (2).
Table 1 (Panel A) shows the descriptive statistics for the full sample of data while Panels B and C show statistics for the pre-COVID-19 and the COVID-19 sub-samples, respectively. The average of Japanese Yen is roughly the same for the full sample and the two sub-samples. When we consider the standard deviation, we see the lowest is reported for the pre-COVID-19 sample (JPY 1.10). The skewness measure is negative in both the full sample and the pre-COVID sample; however, in the COVID-19 sample it is positive, indicating possible asymmetry. The Jarque-Bera test rejects the null hypothesis of normality for all samples in the case of the Yen. Regarding evidence from oil price data, the average is lowest in the COVID-19 sample. The standard deviation is highest in the full sample. However, when we split the data into sub-samples, the standard deviation is higher in the COVID-19 sample. This indicates that the higher volatility in the full sample is mainly coming from the COVID-19 period. For oil price, the null of normality is rejected for all samples. Finally, Panel D reports the descriptive measures for the log percentage returns of the Yen. The average is negative and volatility is higher in the COVID-19 sample compared to the pre-COVID-19 period.
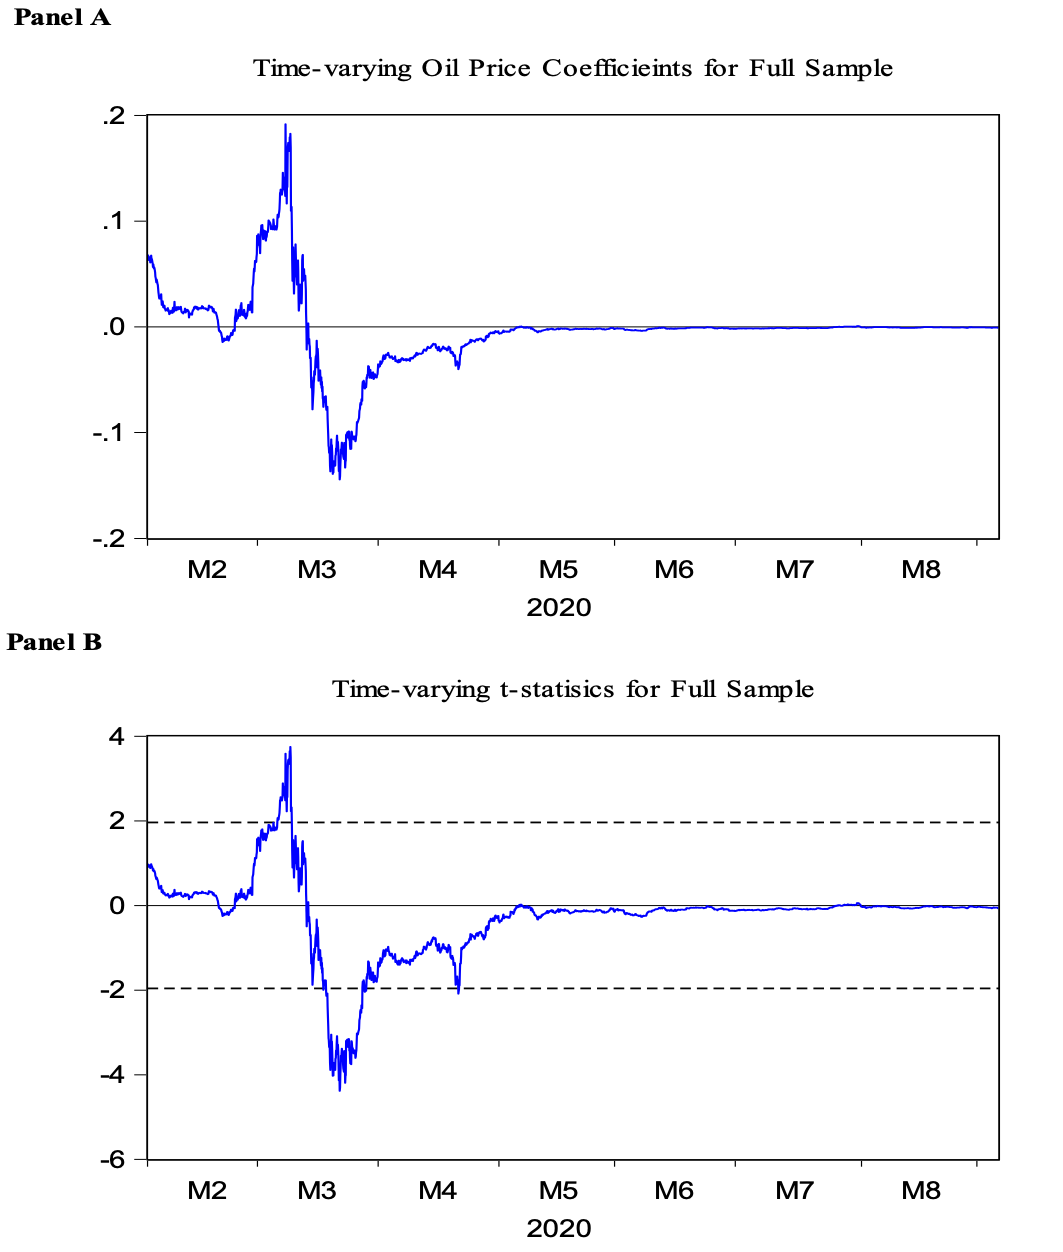
Our objective is to examine the time-varying relationship between the Yen and the oil price. Figure 1 illustrates the results from Equation (2). The recursive coefficients of the oil price variable are presented in Panel A. We have a horizontal line across 0 to differentiate the positive and negative values. We notice that the direction of the relationship is unstable. However, from mid-March 2020 the sign is negative throughout. The corresponding -statistics of the oil price coefficients are plotted in Panel B. The horizontal line at indicates the standard normal distribution values at the 5% level of significance. If the coefficients lie beyond these limits, then the relationship can be considered as statistically significant. We notice that only in the month of March 2020 oil prices predict Yen.
.png)
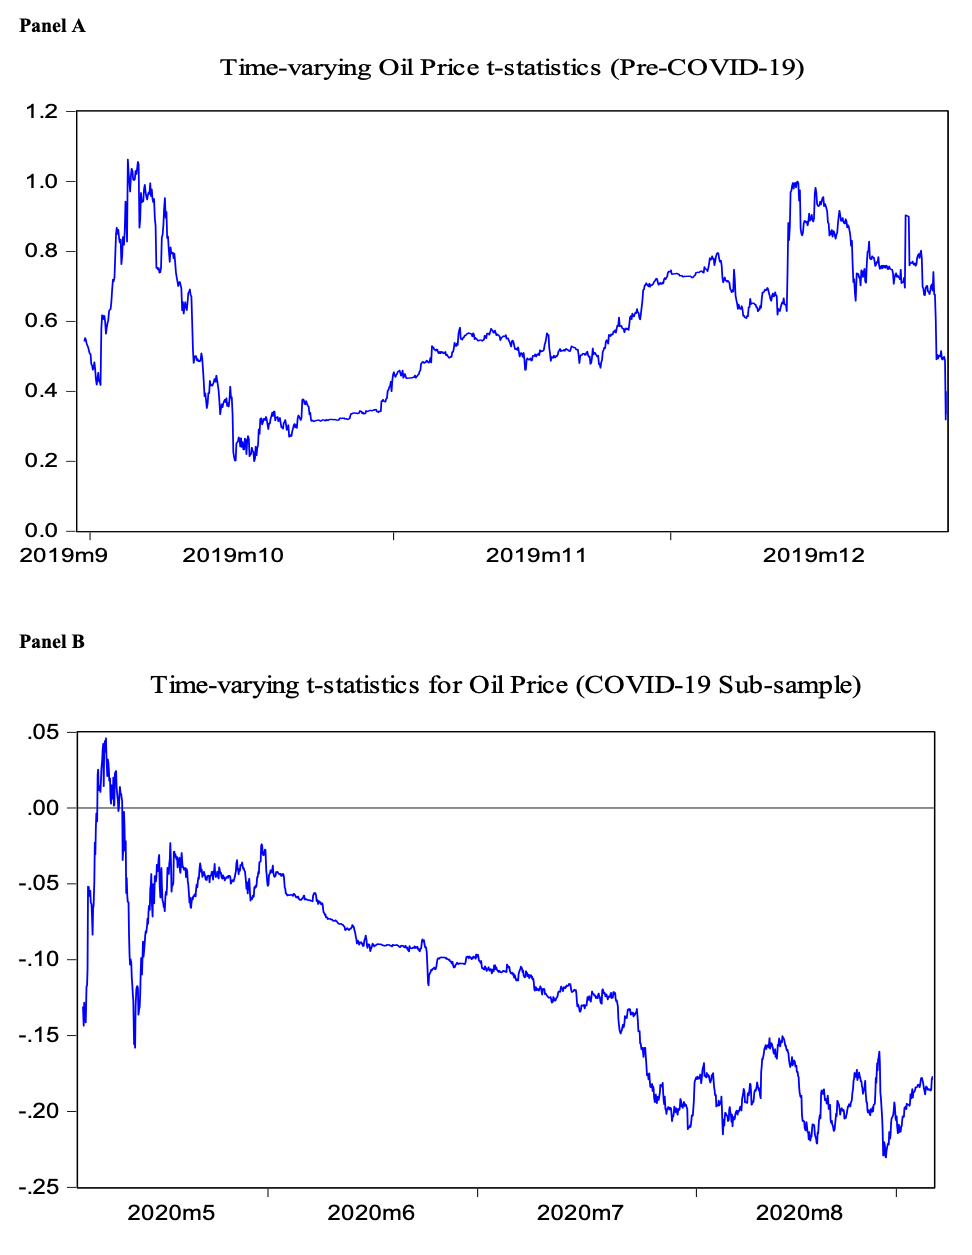
In Figure 2, for the pre-COVID-19 period (Panel A), the -statistics range from 0 to 1.2 and show a positive relationship throughout the pre-COVID-19 period. However, the -statistics for the COVID-19 sample (Panel B) are dominated by negative values. Overall, we do not find evidence that oil prices predict the Yen when using a 50% recursive time-varying approach.

For robustness, we re-estimated Equation (2) by using 25% of the initial data as in-sample and the process is continued until all the data are used. The results are not shown here due to space constraints but are available upon request. We find that the results are consistent with those obtained when using a 50% in-sample window. Again, the only period when oil prices predict the Yen is in March 2020.
IV. Conclusion
We examine the relationship between the Japanese Yen (vis-à-vis the US dollar) and the WTI 1-month oil futures price using hourly data (01/07/2019 to 04/09/2020). Our main contribution is that we test the predictability relationship using a time-varying model. Based on 50% of data in-sample, we find that in only about 6% of the sample oil prices predict the Yen. This relationship only exists in March 2020. Post-March 2020, there is no evidence of any predictability. Our main conclusion, therefore, is that oil prices and the Yen do not share a time-varying predictability relationship.
For oil price and exchange rate relationship, see Basher et al. (2012, 2016); for U.S. dollar and oil relationship, see F. Wen et al. (2018) and D. Wen et al. (2020); for oil price and Indonesia’s exchange rate, see S. Narayan et al. (2019); and for oil price and Fiji’s exchange rate, see P. K. Narayan et al. (2008). Moreover, Liu et al. (2020) examine whether oil price predicts exchange rates.
For Japanese currency and stock market relationship, see P. K. Narayan et al. (2020) study using daily data with the COVID-19 period to pre-COVID-19 period.