
I. Introduction
This paper examines how investment in physical capital, education and research and development (R&D) explain growth in China’s new economy. Our hypothesis is that socially optimal shares of output invested in each sector could sustain economic growth as population growth slows. This hypothesis is motivated by evidence in the literature that R&D and education underpin growth in China’s new economy and is important because China’s population of 1.43 billion, although double what it was fifty years ago, is expected to peak at 1.45 billion in 2030 (United Nations, 2019).
China accounted for one third of global growth in R&D spending between 2000 and 2015. Having invested in physical capital and refined its manufacturing prowess to take advantage of a growing workforce in past decades, China now perceives innovation through R&D as a driver of economic growth (Wei et al., 2017). Empirical analysis of local patents shows a positive and significant relationship with provincial GDP, implying that innovation is an important engine of growth in China (Funke & Yu, 2009).
Figure 1 reveals the change in pace and composition of growth in the past decade. Panel A reflects the transformation from high-speed transitory growth to sustained growth in China’s new economy. Referring to Panel B, China’s investment to GDP ratio initially increased with manufacturing investment, peaked in 2009 with accelerated infrastructure investment and has since moderated, while the household consumption share has increased.
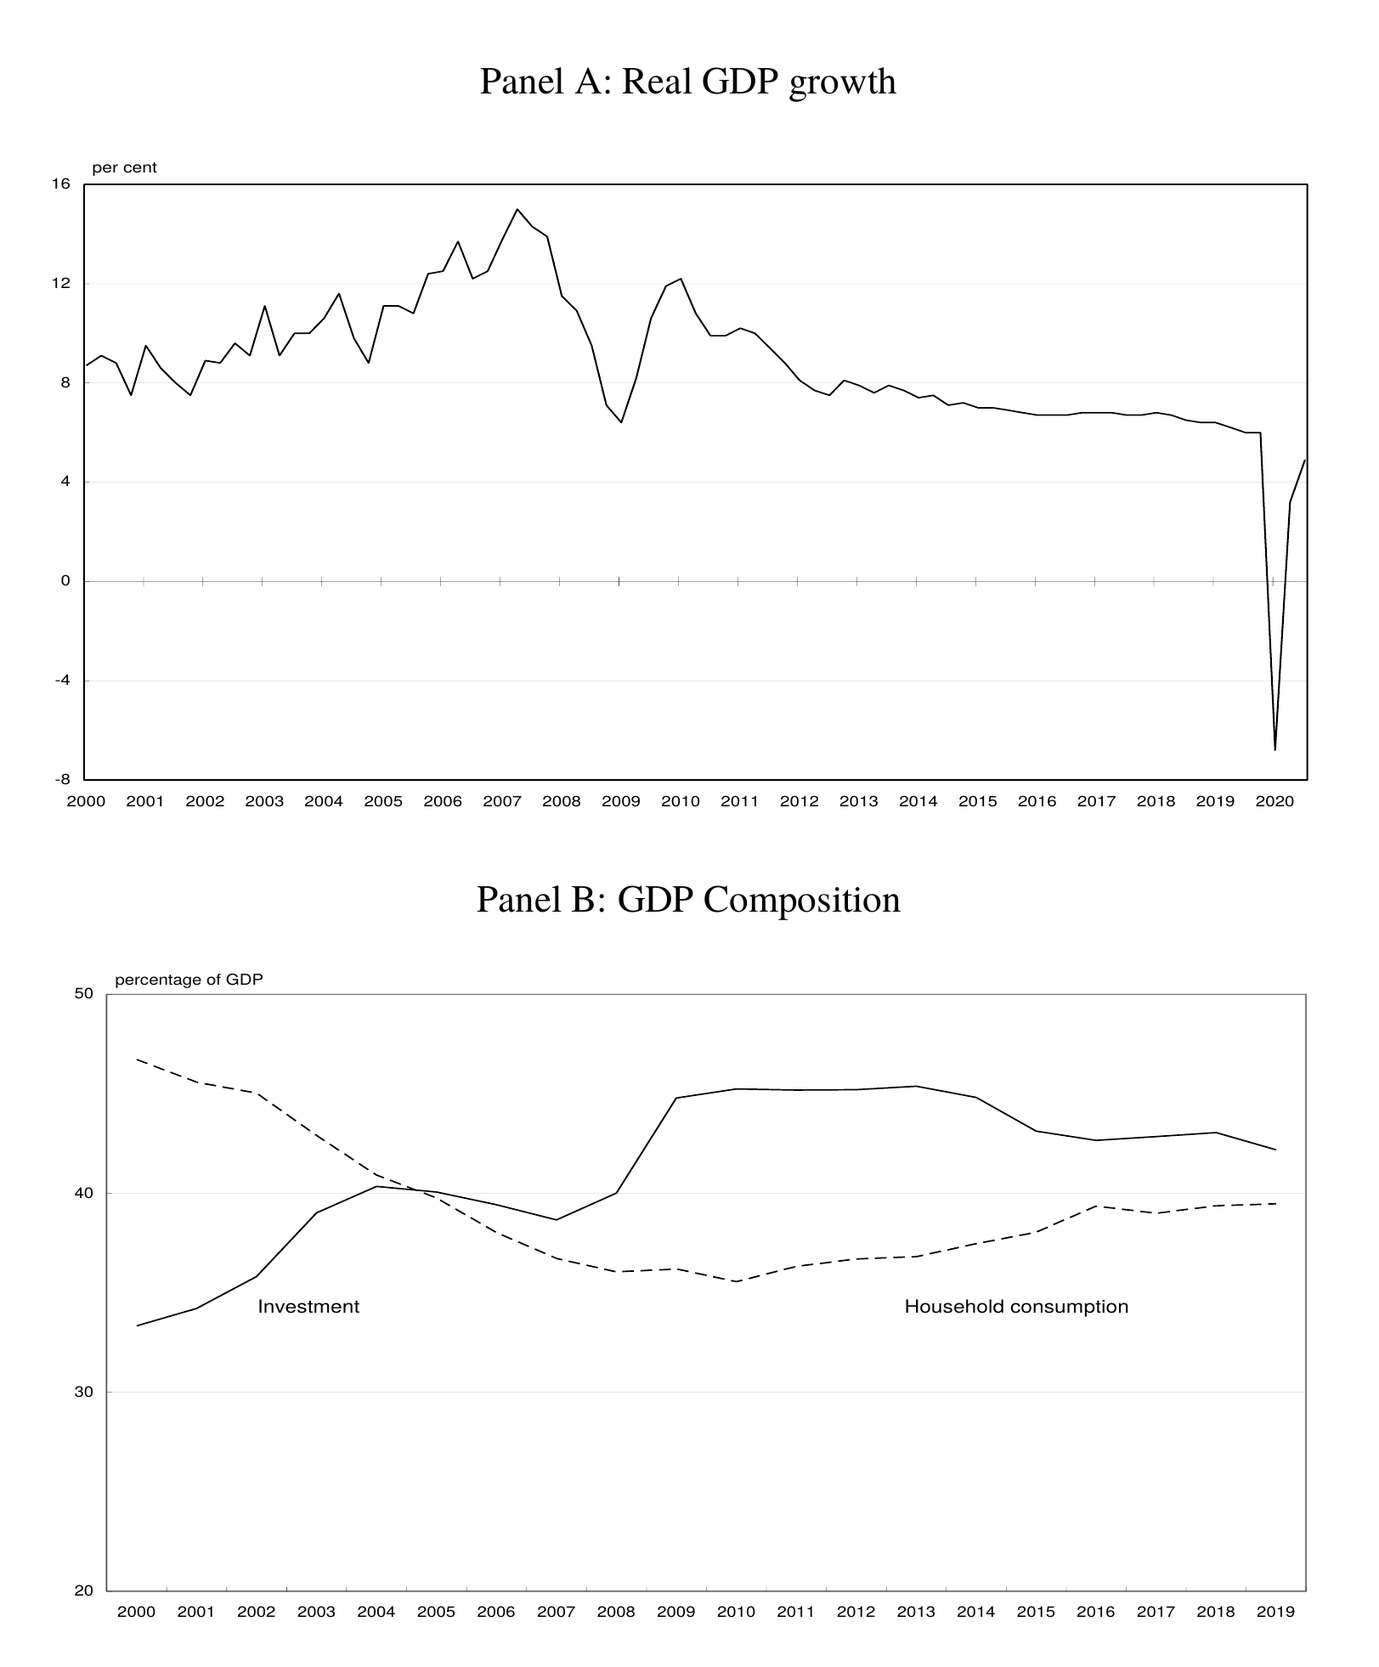
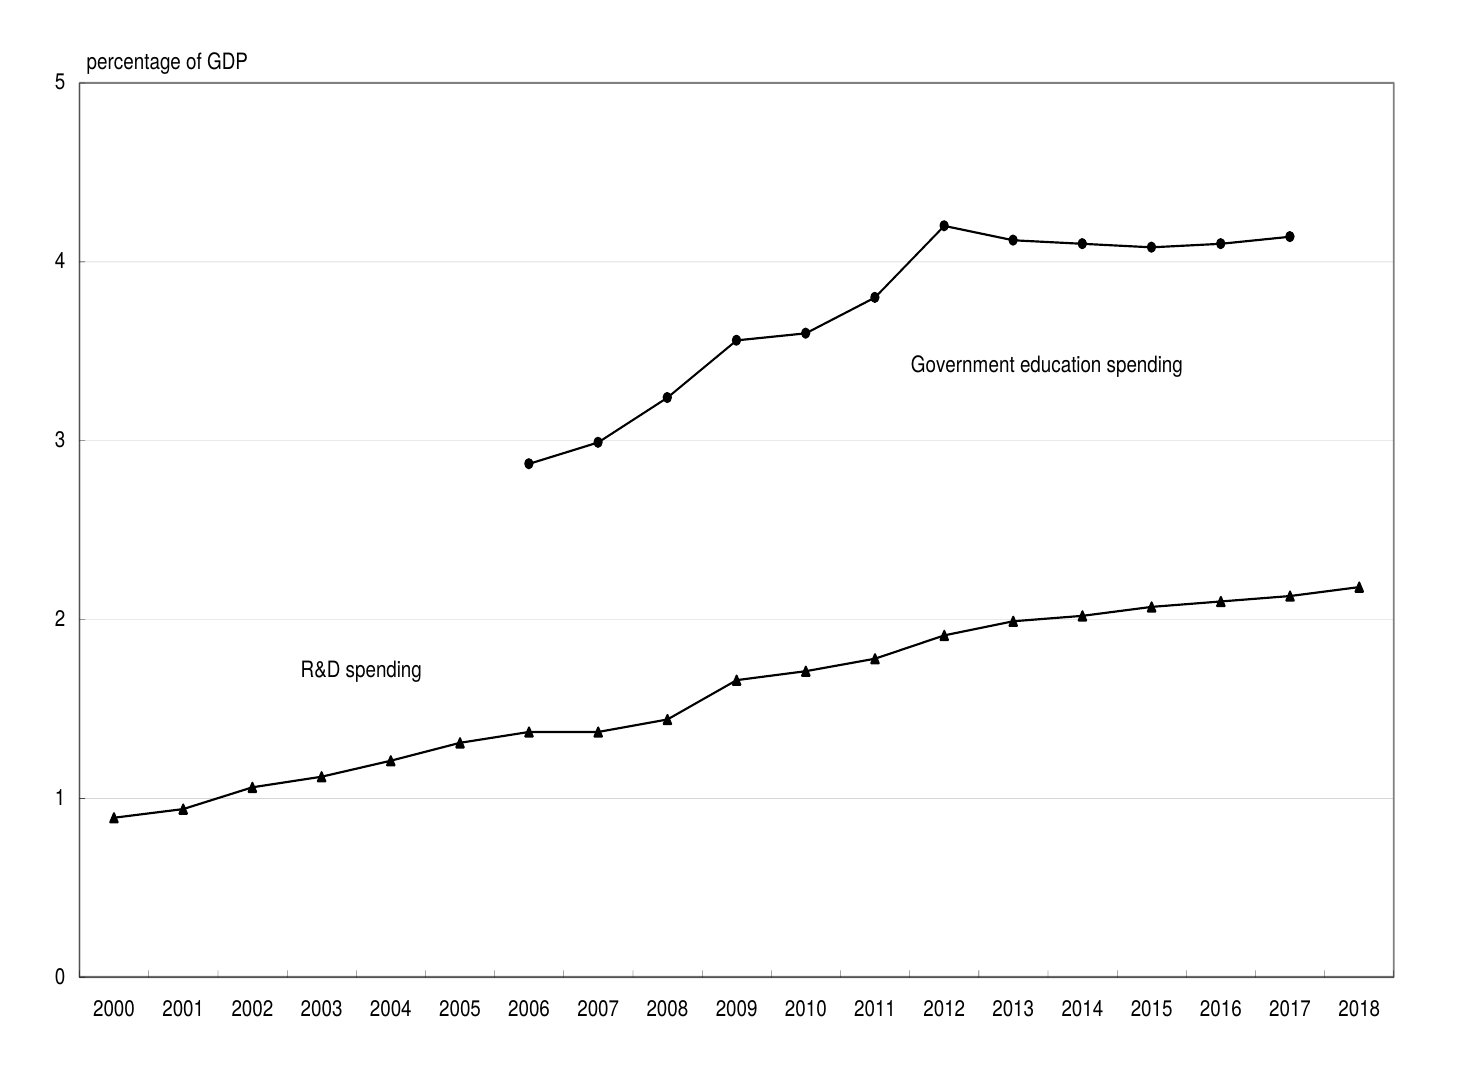
Figure 2 depicts the shares of China’s GDP invested in R&D and education. In 1991, R&D spending accounted for 0.72 per cent of GDP. By 2018, China’s R&D spending had risen to 2.18 per cent of GDP. To put this in perspective, the United States’ R&D spending to GDP ratio has averaged 2.5 per cent since 1990. Government education spending to GDP in China increased from 2.87 per cent in 2006 to 4.14 per cent in 2017 and has remained above the government’s target of 4 per cent since 2011.

Shen et al. (2016) construct an index of China’s new economy sector, defined as intensive in human capital and technology with a relatively low fixed physical capital to output ratio. They find that the new economy accounts for around one third of China’s overall economy. We find the estimated income shares for physical capital, human capital and technology useful to assess the social rate of return to investment in the theoretical model developed herein.
The neoclassical growth model (Solow, 1956) explains how China’s high investment rate equipped a growing workforce with accumulating physical capital to drive per capita output growth during a transition period. Romer (1990) shows how constant marginal returns to researchers’ human capital and existing ideas in R&D sustain a constant rate of technological progress and thus per capita output growth. Funke & Strulik (2000) allow for researchers’ human capital to be produced with constant returns. Investment in human capital supports R&D-based growth as rising human capital per person improves the capacity of an average individual to discover and utilize new technology (Jones & Romer, 2010).
In contrast to the existing literature, we employ a model which relaxes the assumption of constant marginal returns and where a central planner invests output to maximize welfare from consumption per person. Analyzing China’s optimal investment policy and growth prospects has contemporary relevance as investment could suffer under uncertainty during the COVID-19 pandemic. Asian financial markets have become more volatile during the pandemic (Sharma, 2020) and inefficient compared to the pre-COVID-19 period (Narayan, 2020). Financial markets are a disciplinary device for efficient R&D activity which drive economic growth (Juhro et al., 2020). Moreover, the pandemic has increased policy uncertainty in China (Iyke, 2020).
Our findings have two important implications. The first is that China’s slower population growth sustains higher trend economic growth than would otherwise be the case. The second is that China’s shares of output invested in R&D and education will be more important than physical capital investment to sustain economic growth.
II. Growth model for China’s new economy
Let Yt denote output of the final good, At the stock of ideas for new technology, Qt the stock of human capital, Kt the stock of physical capital, Lt the stock of labor which changes over time at an exogenous rate, n, and R is a fixed factor of production (land). Ideas for new technology are non-rivalrous: once an idea is created, anyone with knowledge of the idea can take advantage of it. Rival human capital and physical capital imply Qt=htLt and Kt=ktLt where ht and kt denote human capital per person and physical capital per person, respectively.[1]
Consider the production function for final output:
\[Y = A^{\sigma_{A}}Q^{\sigma_{Q}}K^{\sigma_{K}}R^{\sigma_{R}},\ \ 0 < \sigma_{i} < 1\forall i \tag{1}\]
where Final production features constant returns to scale in rivalrous factors, Q, K and R, but increasing returns to scale in non-rivalrous ideas, A, and rivalrous factors taken together. The stocks of technology, human capital and physical capital accumulate endogenously according to:
\[\dot{A} = s_A Y \tag{2a}\]
\[\dot{Q} = s_Q Y \tag{2b}\]
\[\dot{K} = s_K Y \tag{2c}\]
where si (i=A,Q,K) are shares of output invested in R&D, education and physical capital accumulation. Ideas for new technology, human capital and physical capital accumulate as a residual after aggregate consumption needs have been met:
\[Y - C = \dot{A} + \dot{Q} + \dot{K} \tag{3}\]
where C=cL and c denotes consumption per person.
The social planner chooses c and si so as to maximize discounted intertemporal utility
\[U = \int_{0}^{\infty}{e^{- \rho t}\frac{c^{1 - \theta}}{1 - \theta}}dt,\ \ \rho > 0;\ \theta > 0 \tag{4}\]
subject to the production and accumulation constraints (1), (2a)-(2c). The first order conditions for a social optimum are:
\[\pi L = \mu = \gamma = c^{- \theta} \tag{5a}\]
\[\rho - \frac{\dot{\pi}}{\pi} = \sigma_{A}\frac{Y}{A} \tag{5b}\]
\[\rho - \frac{\dot{\mu}}{\mu} = \sigma_{Q}\frac{Y}{Q} - n \tag{5c}\]
\[\rho - \frac{\dot{\gamma}}{\gamma} = \sigma_{K}\frac{Y}{K} - n \tag{5d}\]
where π, μ and γ are the shadow values for stocks of ideas, human capital and physical capital, respectively, and σi denotes the elasticity of output with respect to each endogenous stock.
Equation (5a) determines the optimal path in consumption per person. Equations (5b), (5c) and (5d) equate the returns to ideas, human capital and physical capital, thereby determining the optimal shares of invested output along a balanced growth path where technology and per capita output, consumption, human capital and physical capital grow at constant rates.
The rivalry of human capital, Q, and physical capital, K, implies a capital dilution effect whereby growth in the stock of labor reduces capital per person. Substituting Q=hL and K=kL into (2b) and (2c) yields:
\[\dot{h} = \frac{{s_{Q}A}^{\sigma_{A}}Q^{\sigma_{Q}}K^{\sigma_{K}}R^{\sigma_{R}}}{L} - nh \tag{6a}\]
\[\dot{k} = \frac{{s_{K}A}^{\sigma_{A}}Q^{\sigma_{Q}}K^{\sigma_{K}}R^{\sigma_{R}}}{L} - nk \tag{6b}\]
where sQ and sK are chosen by the social planner.
From (1), socially optimal endogenous stocks relative to output are:
\[\frac{A}{Y} = \frac{\left( \sigma_{A} \right)^{1 - \sigma_{A}}}{\left( \sigma_{Q} \right)^{\sigma_{Q}}\left( \sigma_{K} \right)^{\sigma_{K}}R^{\sigma_{R}}} \tag{7a}\]
\[\frac{Q}{Y} = \frac{\left( \sigma_{Q} \right)^{1 - \sigma_{Q}}}{\left( \sigma_{A} \right)^{\sigma_{A}}\left( \sigma_{K} \right)^{\sigma_{K}}R^{\sigma_{R}}} \tag{7b}\]
\[\frac{K}{Y} = \frac{\left( \sigma_{K} \right)^{1 - \sigma_{K}}}{\left( \sigma_{A} \right)^{\sigma_{A}}\left( \sigma_{Q} \right)^{\sigma_{Q}}R^{\sigma_{R}}} \tag{7c}\]
which imply constant, albeit different, long run trends in socially optimal technology, aggregate human capital and physical capital to GDP ratios. Intuitively, the higher the marginal return, the higher the social rate of return to output invested in the stock and thus the higher the socially optimal stock to GDP ratio.
From (7), the ratios of per person human capital and physical capital to ideas are:
\[\frac{h}{A} = \frac{\sigma_{Q}}{\sigma_{A}L} \tag{8a}\]
\[\frac{k}{A} = \frac{\sigma_{K}}{\sigma_{A}L} \tag{8b}\]
which implies gh = gk = gA - n. Socially optimal investment equates the marginal product in final production of ideas, aggregate human capital and aggregate physical capital. The socially optimal ratio of individual human capital to ideas, given by equation (8a) equates the marginal product of ideas and aggregate human capital, σAY/A and σQY/(hL). The ratio of individual human capital to ideas is decreasing in L due to a capital dilution effect in education and increasing in σQ due to the relatively higher share of output invested in education. The following proposition summarizes this result.
Proposition 1. The socially optimal ratio of individual human capital to ideas is increasing in the output elasticity for human capital and decreasing in population size.
The intuition lies in Equations (2a) and (6a). The numerator in the first term of (6a) is investment in education which draws on existing ideas, human capital and physical capital. The denominator in the first term of (6a) captures a capital dilution effect that is absent in (2a) due to the non-rivalrous nature of ideas. Growth in individual human capital depends on the ratio of education investment to number of students and is therefore decreasing in population size. However, from Equation (7b), the socially optimal share of output invested in education, sQ, is increasing in the output elasticity of human capital.
Differentiating (5a) with respect to time and substituting from (5b)-(5d), socially optimal long run growth in per capita output is:
\[\begin{align} g_{y} &= g_{c} = g_{h} = g_{k} = g_{A} - n \\ &= \frac{1}{\theta}\left\lbrack \left( \sigma_{A} \right)^{\sigma_{A}}\left( \sigma_{Q} \right)^{\sigma_{Q}}\left( \sigma_{K} \right)^{\sigma_{K}} - \rho - n \right\rbrack \end{align}\tag{9}\]
where the social rate of return to invested output is Due to the non-rivalrous nature of ideas, growth in ideas outstrips growth in per capita physical capital and human capital by the rate of population growth. By implication, growth in per capita output is decreasing in population growth. The following proposition summarizes this result.
Proposition 2. Long run growth in per capita output is decreasing in population growth and increasing in the social rate of return to output invested in ideas, human capital and physical capital.
Intuitively, the social planner invests unconsumed income to grow aggregate stocks of ideas, human capital and physical capital and thus consumption per person over time. Socially optimal investment equates the rates of return across stocks and thus the marginal product of ideas, human capital and physical capital in final output. This gives the first term in the square brackets.
Substituting in (1) for (8a) and (8b), the long run level of per capita output is
\[y_{t} = \left( \sigma_{A} \right)^{\sigma_{A}}\left( \sigma_{Q} \right)^{\sigma_{Q} - 1}\left( \sigma_{K} \right)^{\sigma_{K}}R^{\sigma_{R}}h_{0}e^{g_{y}t} \tag{10}\]
which is increasing in the fixed factor, R, and the initial stock of human capital per person, h0, but is independent of initial population size, L0. Thus, there is no scale effect from population, implying that living standards will be higher in the long run despite zero population growth. This result is summarized in the following proposition.
Proposition 3. The long run level of per capita output is increasing in land size and initial skill level of the average individual but is independent of the population size.
In Equations (9) and (10), output elasticities with respect to human capital and physical capital affect both the long run growth rate and level of per capita income. However, the instantaneous effect on the level of per capita output is overshadowed by the effect on long run growth in per capita output, gy.
For each σi (i = A,Q,K),
\[\frac{\partial\left( \sigma_{i} \right)^{\sigma_{i}}}{\partial\sigma_{i}} = \left( \ln{\sigma_{i} + 1} \right)\left( \sigma_{i} \right)^{\sigma_{i}} \geq 0\overset{\mathstrut}{\Leftrightarrow}\sigma_{i} \geq e^{- 1} \tag{11}\]
where e-1≈0.3679 compares with Shen et al.'s (2016) physical capital income share of 35% for the new economy in China. Shen et al. (2016) calibrate human capital and technology income shares of 40% and 25%, respectively. Referring to Equation (11), (0.4)0.4≈0.7 and (0.25)0.25≈0.71, which implies a high and low elasticity of human capital and ideas, respectively, has a commensurate effect on the social return to investment which is greater than that of physical capital. The following proposition summarizes this illustrative example.
Proposition 4. China’s low output elasticity of ideas and high output elasticity of human capital individually contribute more than physical capital to the socially optimal return and long run growth in per capita output.
Intuitively, the socially optimal return to investment equals the marginal product of ideas, human capital or physical capital, which in turn equals output elasticity multiplied by average product. For a given average product, marginal product is increasing in output elasticity. However, the average product is endogenously determined by socially optimal investment whereby a higher output elasticity attracts an increase in the share of output invested in the stock and thus reduces its average product. These two effects offset each other for σK=0.35, which means physical capital implies a relatively low socially optimal return to investment. For lower and higher output elasticities, the two effects do not offset each other. Thus, σA=0.25 and σQ=0.40 equally contribute to a high socially optimal return to investment.
III. Conclusion
The model in this paper shows that socially optimal shares of output invested in R&D, education and physical capital accumulation can sustain China’s economic growth as population growth slows. First, China’s high human capital income share is consistent with socially optimal expenditure on education for a large student population with the capacity to crowd out growth in student quality. Second, China’s slowing population growth boosts per worker physical capital and skill employed in R&D to sustain a higher trend growth rate than would otherwise be the case. Third, future living standards will be higher due to current average educational attainment. Finally, China’s spending on R&D and education as a share of output contributes more than physical capital investment to economic growth.
The analysis herein drops time subscripts for convenience.