
I. Introduction
The objective of this paper is to explore whether the novel coronavirus disease (henceforth referred to as COVID-19) leads to price bubbles in medical mask in the context of China. The World Health Organization (WHO) officially declared, as of 16 October 2020, that COVID-19 had spread to 216 countries or regions and resulted in more than a million deaths worldwide since its outbreak in the late 2019. Because droplet transmission is an important channel for the spread of COVID-19 (Gates, 2020), experts recommend that people should wear medical masks in public places. As a result, the demand for medical masks and protective equipment has dramatically increased. Once the fundamental value of the medical masks is determined, the price is mainly affected by supply and demand (Su et al., 2017). The ordinary medical mask price has skyrocketed, from less than 0.5 Yuan to 5 Yuan, and at least until March 2020, was in short supply. This led to investors’ optimism for the medical equipment stocks, and further boosted stock prices. Generally, the asset price bubble or speculative bubble is often accompanied by persistent market overvaluation followed by the market collapse (Reza, 2010). These price spikes are formed by changing stock prices irrespective of fundamentals of the asset valuation and heavily influenced by strong and highly active market trend (Huang & Zheng, 2020; Joarder et al., 2014).
The pandemic can trigger negative reactions of labor markets, global supply chains, consumption and saving behaviors, all of which can affect economic growth prospects (Ertuğrul et al., 2020; Su et al., 2020; Vidya & Prabheesh, 2020). One of the most important components of the economic system that responds to a pandemic is the equity market, which has always been regarded as a barometer of the national economy (Salisu & Sikiru, 2020). With the outbreak of COVID-19, the stock market plummeted globally, triggering the enormous fears and turmoil in financial markets (Nicola et al., 2020). This suggests that pandemics also affect investors’ expectations, which may cause stock returns to fall. However, a heterogenous reaction of industries to the global public health emergency has been found because a firm’s performance determines its stock price and market expectations (P. He et al., 2020). P. He et al. (2020) find that high-tech industries, such as information technology, education, medical industries, are resilient to the pandemic although the overall stock returns decline. Consequently, it motivates us to investigate the explosive behavior in the stock prices of medical equipment, especially the medical face masks.
The topic of stock price bubbles has been important. The literature on the identification of bubbles from market fundamentals stems from the Lucas (1978) asset pricing model. Since then, substantial research on bubbles in asset price using different methods have been conducted (see Diba & Grossman, 1988; Froot & Obstfeld, 1991; Shiller, 1981). Gürkaynak (2008) confirms the existence of bubbles in the stock market theoretically and empirically. Yao & Luo (2009) show the occurrence and crash of stock bubbles in the period of the 2008 financial crisis 2008. Narayan et al. (2013) use 589 firms and find evidence that share price volatility has impacted asset price bubbles. Hu & Oxley (2018) focus on two famous and six less famous 18th century share price series and they confirm evidence of bubbles. Q. He et al. (2019) emphasize the role of structural changes when detecting bubbles and find existence of bubbles in the telecommunications and health care industries.
As a public health incident of international concern, COVID-19 has a negative impact on the stock market. Existing studies investigate the influence of COVID-19 on liquidity, returns, volatility, and fluctuation in equity markets (Haroon & Rizvi, 2020; Iyke, 2020; Iyke & Ho, 2021; Narayan, 2020; Phan & Narayan, 2020; Sharma, 2020). However, there is limited industry-level research on the effects of COVID-19 on stock prices (P. He et al., 2020; Saadat et al., 2020) although some studies concentrate on oil firms or sectors (Prabheesh, Garg, et al., 2020; Prabheesh, Padhan, et al., 2020). We contribute to the current studies by taking account of the explosive behavior of the firm-level dataset, especially the medical care industry during the pandemic. Using the sup ADF and the generalized sup ADF (GSADF) tests, we trace the bubble process and consistently date its origin and collapse. The results show that bubbles occur in medical mask firms although there is no explosive behavior in the overall stock market in China.
The article is organized as follows. Section II constructs a theoretical model and introduces the methodology. Section III describes the dataset and presents the empirical results. Section IV contains concluding remarks.
II. Model and Methodology
According to Shiller (1984) and Evans (1991), the notion that asset prices or commodity prices might deviate from their intrinsic values based on market fundamentals because of speculative bubble is widely accepted. Evans (1991) proposes that the stock price under the no arbitrary condition can be written as:
Pt=Et(Pt+1+Dt+1)1+r
where is the dividend payoff of the stock between time t and t+1; r denotes the discount rate; and is the conditional expectation at t. Then the forward-looking solution to Eq. (1) can be signified by which is determined by expected future dividends:
Ft=∞∑i=1(1+r)−1Et(Dt+i)
Therefore, contains fundamental values and bubbles component as follows:
Pt=Ft+Bt
where
If then represents the explosive behavior inherent in
Diba & Grossman (1988) employ the stationarity test for the logarithmic asset price and observable market fundamentals considering the explosive attribute of bubbles. The conventional stationarity test is based on the standard ADF test, which has an explosive alternative hypothesis. Consider the following model:
pt=α+βpt−1+k∑i=1γiΔpt−i+εi, εi∼NID(0,σ2)
where is the logarithmic stock price and is the number of lags. The null hypothesis is meaning that is a unit root process, i.e., is nonstationary. The alternative hypothesis is which implies that is explosive and is stationary. However, Phillips & Yu (2011) argue that their tests have discriminatory power in that they are sensitive to changes when a process changes from a unit root to a mildly explosive root or vice versa. This sensitivity is much greater in the left-tailed unit root test against stationary alternatives. Therefore, Phillips & Yu (2011) propose the supreme of recursively determined ADF (sup ADF) t-statistic to detect periodically collapsing bubbles.
The sup ADF (SADF) test relies on repeated estimation of the ADF model on a forward expanding sample sequence, and the test is obtained as the sup value of the corresponding ADF statistic sequence. The SADF statistic is defined as follows:
SADF(r0)=sup
where the window size expands from to 1, is the smallest window width and 1 is the total sample size.
SADF has proven to be effective when there is a single bubble episode in the sample period. However, there may be multiple bubbles in the price. Phillips et al. (2012, 2013) demonstrate that when the sample period contains multiple bubble episodes, the SADF test may not be appropriate. The generalized SADF (GSADF) test is better in this case as it introduces flexible window widths in its implementation to address multiple periods of exuberance and collapse. The GSADF test extends the sample coverage by changing the beginning and the ending points of the recursion over a feasible range of flexible windows. Phillips et al. (2012, 2013) define the GSADF statistic to be the largest ADF t-statistic over the feasible ranges of and as follows:
\text{GSADF}\left( r_{0} \right) = \sup_{r_{2} \in \left( r_{0},1 \right),r_{1} \in ({0,r}_{2} - r_{0})}\left\{ {ADF}_{r_{1}}^{r_{2}} \right\} \tag{6}
When the regression model includes an intercept and the null hypothesis is a random walk with an asymptotically negligible drift, we present the limit distribution of the GSADF test statistic as follows:
\begin{align} \sup&\mathstrut_{r_{2} \in \left( r_{0},1 \right),r_{1} \in ({0,r}_{2} - r_{0})} \biggl( \Bigl\{\frac{1}{2}r_{w}\left\lbrack {w\left( r_{2} \right)}^{2} - {w\left( r_{1} \right)}^{2} - r_{w} \right\rbrack \\&- \int_{r_{1}}^{r_{2}}{w\left( r \right)d_{r}\lbrack w\left( r_{2} \right) - w(r_{1})\rbrack}\Bigr\} \\&\Big/\Bigl\{r_{w}^{\frac{1}{2}}\left\{ r_{w}\int_{r_{1}}^{r_{2}}{{w\left( r \right)}^{2}d_{r} - \lbrack\int_{r_{1}}^{r_{2}}{w(r)d_{r}\rbrack^{2}}} \right\}^{\frac{1}{2}}\Bigr\} \biggr)\end{align} \tag{7}
where is a standard Wiener process. The right-tail critical values of the GSADF statistic are larger than those of the SADF statistic. We implement numerical simulations to obtain the asymptotic critical values and employ a bootstrap method to compute the finite sample distributions.
III. Data and Empirical results
We choose three main listed companies of medical mask (Zhende Medical, Lanfan Medical, and Yingke Medical Co., LTD) in China for the empirical analysis. For comparison, we also select the series of Shanghai Composite Index (SHCI) and Shenzhen Component Index (SZCI) to capture the overall market situation. Their daily stock closing prices are from 2019.01.02 to 2020.10.12 and are sourced from the Wind database. In order to explore whether COVID-19 influenced the price of medical masks explosively, this time span covers a year before the outbreak of the COVID-19 pandemic and the entire period from the outbreak to the current time of the pandemic.
We then employ the SADF and GSADF tests to examine if there are bubbles in the stock price of medical masks. Several conclusions could be drawn from the results presented in Table 1. We, for instance, infer that there are bubbles in the stock prices for these three companies. Specifically, since the SADF and GSADF values exceed the critical values at the 1% significance level, we thus reject the null hypothesis of Therefore, we can conclude that medical mask prices contain bubbles. However, the null hypothesis cannot be accepted in SHCI and SZCI, which means explosive bubbles do not exist in the overall stock market during the COVID-19 pandemic.
According to Panel A of Figure 1, it can be seen that the Zhende Medical stock price is stable before 2020. However, on three occasions, price bubbles were found in 2020. The first bubble originated on 10 January and ended on 12 February, which coincides with the initial outbreak of COVID-19. Because wearing masks can reduce the infection rate, experts recommended wearing masks when in public space, which led to masks been sold out. Additionally, most factories reduced their production or even closed due to the Chinese Spring Festival. The shortage of mask supply led to a sharp rise in the price of masks. This boosted the share price of medical masks. With factories resuming production, the mask supply concern was eased, resulting in a fall in share prices and the burst of the bubble. The second bubble is between 9 and 16 March, 2020. This bubble can be attributed to the medical mask exports to Japan and Korea. We notice the last bubble is located between 3 June to 17 August, lasting more than 2 months. As the COVID-19 became a global pandemic, countries, companies, hospitals, and individuals started competing for these medical protective goods (Fuchs et al., 2020). Furthermore, 44% of the world’s exports of face masks originated from China in 2018 (UN Comtrade, 2020). And thus, global competition over Chinese medical supplies has intensified. Investors or speculators, therefore, keep optimistic expectations for stocks related to Chinese medical equipment, contributing to bubbles in the face mask market.
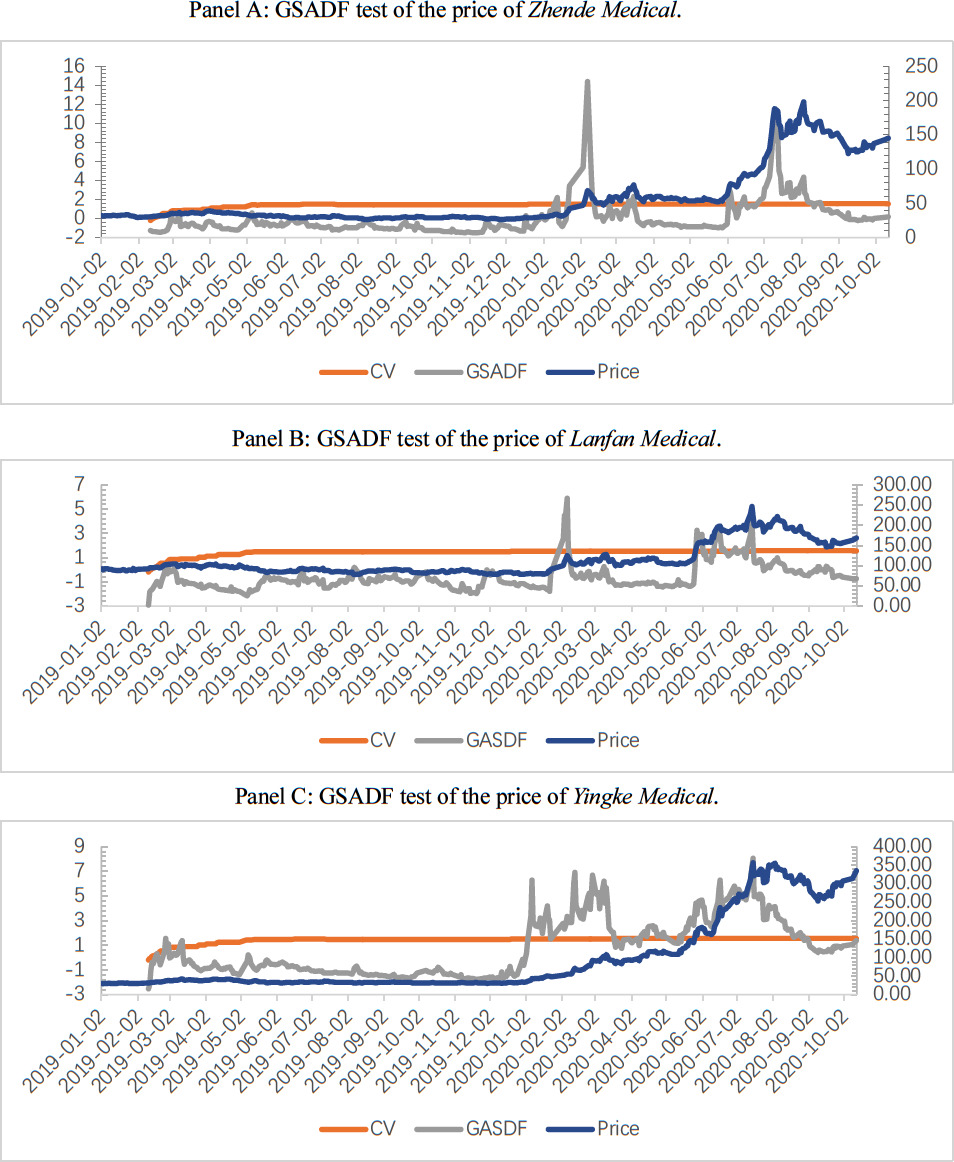
From Panels B and C of Figure 1, we find a very similar evidence of multiple bubbles in 2020. Specifically, bubbles occurred between 3 to 10 February and between 3 June to 10 August in Lanfan Medical price (see Panel B). According to Panel C, there exist bubbles from 3 January to 20 March, from 9 April to 7 May, and from 22 May to 28 August in Yingke Medical price. The stock prices of medical masks have remained stable before the year 2020. However, the prices fluctuate significantly since the outbreak of COVID-19. Moreover, the dates of explosive bubbles coincide with the occurrence of the COVID-19 related events. As a result, we believe the pandemic leads to the investors’ optimistic expectations for medical masks stock because supply and demand will continue to be tight from a global perspective if the pandemic persists.
IV. Conclusion
This paper analyzes the explosive behavior of stock prices of medical masks during the COVID-19 pandemic. Using the GASDF method, we find that there exists multiple bubbles in the three stock prices but not in the overall stock market. Furthermore, the occurrence of bubbles is significantly affected by the COVID-19 related events. Facing the situation of a high demand for medical masks, investors or speculators are generally optimistic about medical stocks. Therefore, investors should maintain a rational attitude towards medical stock shares so as to prevent the loss of earnings caused by bubble burst.