I. Introduction
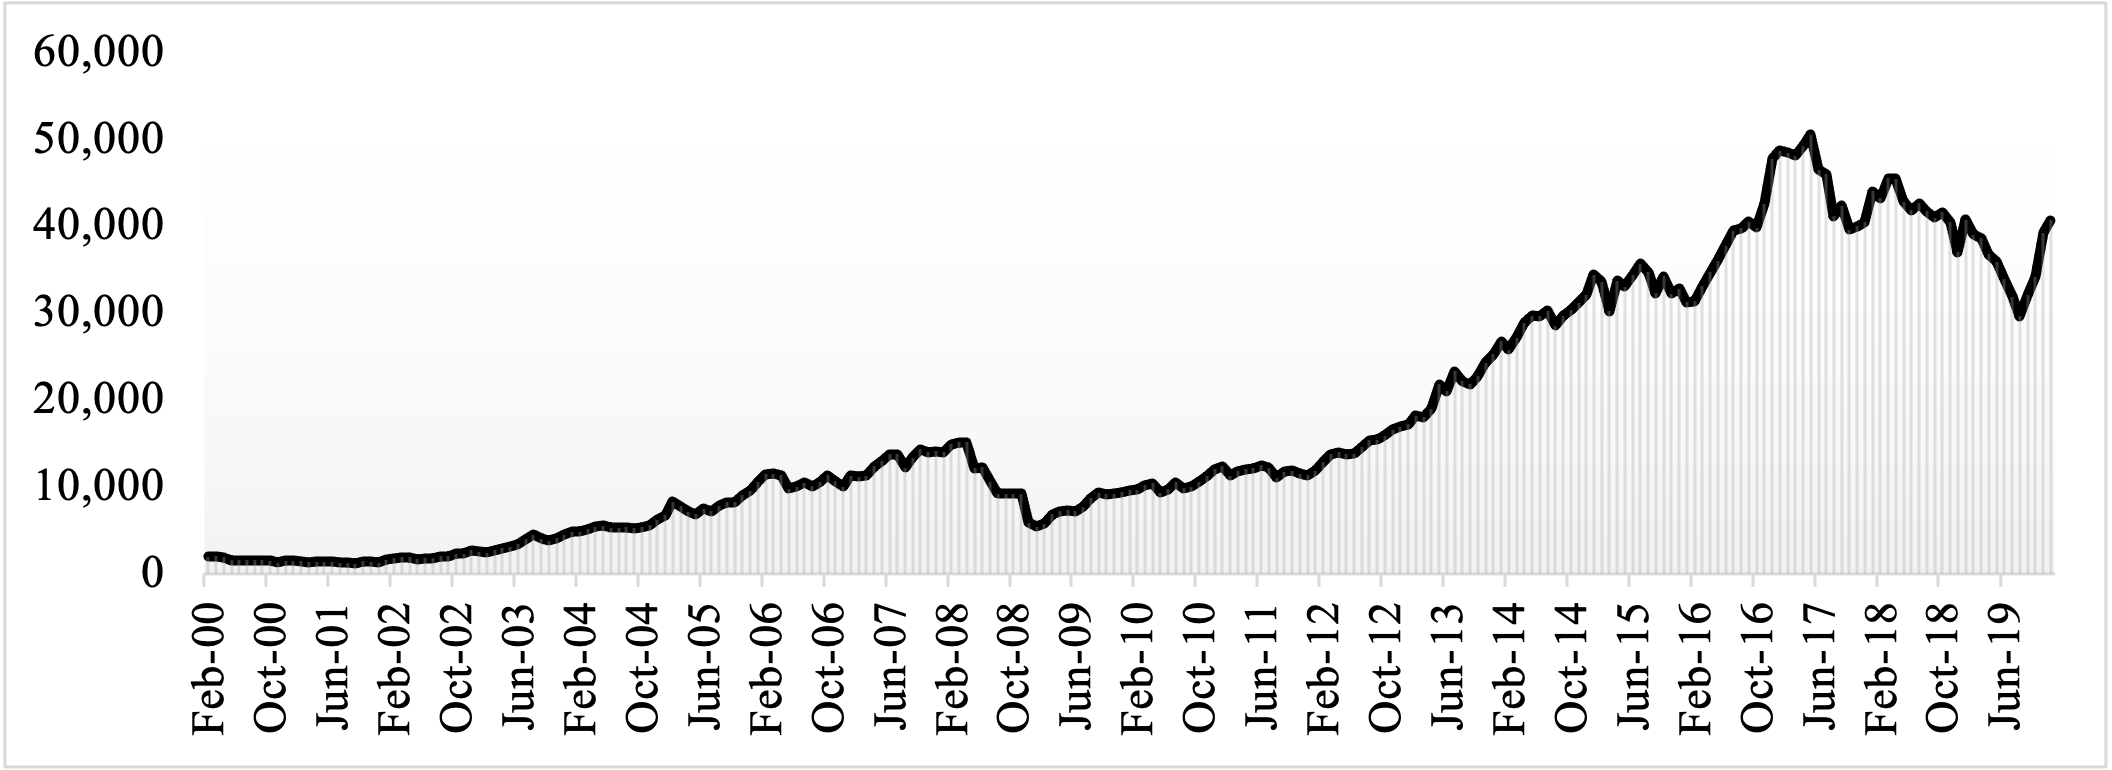
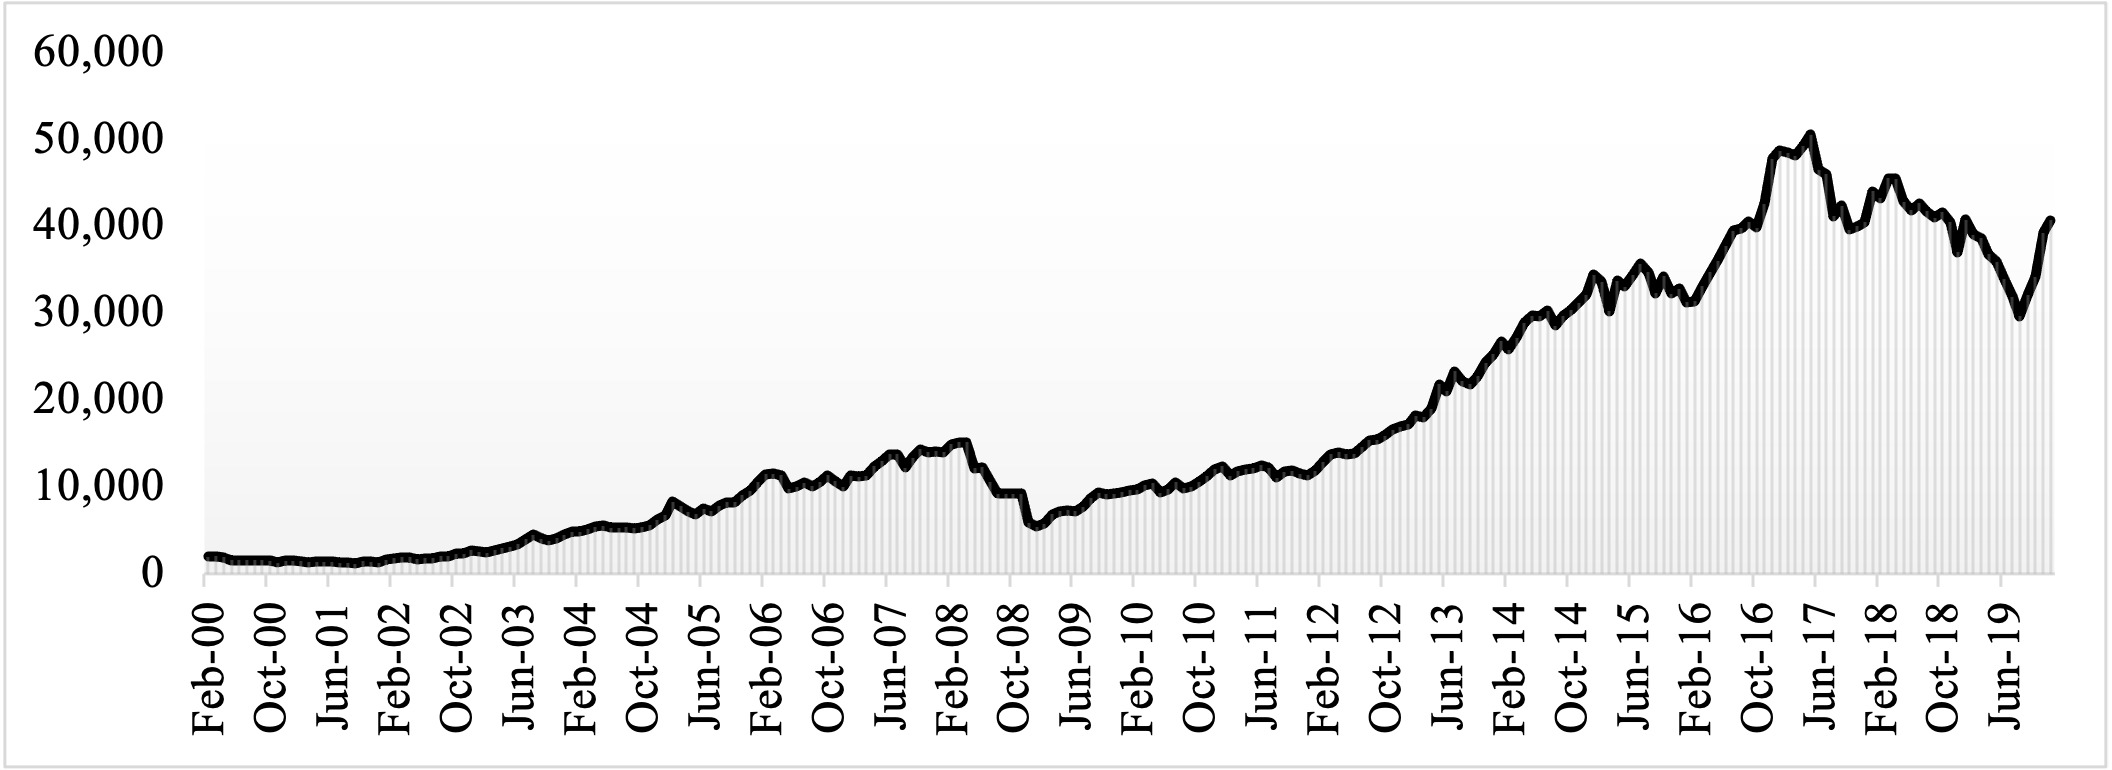
For most of its empirical life, the notion of market efficiency has been a controversial subject in financial economics (Chordia et al., 2005). If investors have a complete representation of all available stock price information, the stock market will be known as a strong type of efficient market, as described by Fama (1970), who also introduced weak and semi-strong forms of stock market efficiency. Furthermore, Fama et al. (1969) cited considerable literature supporting market efficiency, with stock markets responding rapidly to new knowledge and subsequent independent stock price shifts. However, Louhichi (2008) documented that the empirical literature does not support the strong form of market efficiency. Pakistan’s stock exchange is characterized by an emerging market status, comprising 36 sectors with 552 stocks and Rs 6,887.30 billion in market capital. Figure 1 shows that the KSE-100 index for the past two decades has exhibited an increasing trend.
The primary purpose of this analysis is to empirically examine how quickly stock prices change in response to new information, such as a dividend announcement, to provide evidence-based insights and strategies for financial analysts, researchers, stakeholders, policymakers, and practitioners to understand the behavior of stock markets in response to new information. More precisely, this paper attempts to analyze how much time it takes for stock prices to converge to/resume their equilibrium around dividend announcements on the Pakistan Stock Exchange (PSE). To do so, we obtain data on the 10 highest-earning ((or lucrative) sectors of the PSE from 2000 to 2018 and use an event study methodology (ESM) to measure stocks’ abnormal returns. We find that stock prices adjust immediately, that is, after one day of dividend announcements on the PSE.
The motivation behind choosing the PSE for the analysis is that it comprises stocks from the Karachi, Lahore, and Islamabad stock exchanges and thus reflects all of Pakistan’s economic activities. Moreover, Morgan Stanley Capital International) classified the PSE as an emerging market in 2017, which motivated us to examine its behavior by analyzing the speed of adjustment of stock prices around dividend announcements. When studies focus on emerging markets, Pakistan is often ignored. Our work by focusing on Pakistan, therefore, offers a fresh perspective.
Many studies (Aharony & Swary, 1980; Below & Johnson, 1996; Bhana, 2015; Nartea et al., 2021; Oehler et al., 2017) have investigated the speed of adjustment of stock prices to new information. However, none, to the best of our knowledge, have estimated the speed of adjustment of Pakistan’s stock prices around events. This information can be useful for investors in devising trading strategies. The works that come the closest to our paper are those of Chaudhary et al. (2016), Mahmood et al. (2011), and Nazir et al. (2010), who use stock data from the PSE to investigate the responsiveness and behavior of stock returns around events; however, they do not estimate the speed of adjustment.
II. Methodology
The behavior of stock returns can be investigated around dividend announcements with an ESM. Fama et al. (1969) primarily used this methodology to analyze the adjustment of stock returns to new information. Many studies employed an ESM to examine the performance of stock prices around a particular event. The ESM can be outlined as follows:
-
First, the study identifies the event of interest, which, in this article, is the dividend announcement date.
-
We then calculate the normal returns for the stocks and the market during the control period, also called the estimation window.
-
Next, we measure the residuals as the deviation of the actual returns in the event window and the estimated returns in the control period.
-
Lastly, we run a statistical test to check the significance of the calculated variables.
A. Description and calculation of the variables
We calculate the normal return of stock at time as
Rit=ln(Pit+1Pit)
where is the closing price of stock i at time and is the current value of stock The KSE-100 index data are collected for the calculation of the market return at time
Rmt=ln(Pmt+1Pmt)
where is the closing price of the KSE-100 index.
Using the normal and market returns from equations (1) and (2), respectively, we obtain
Rit= αi +βiRmt + εit
where the parameters and for stock i are estimated with ordinary least squares and satisfies the common assumptions of the classical linear regression model. These parameters are calculated for a 100-day estimation window. This study uses these estimated coefficients to then calculate abnormal returns for an event window of 15 days (±7 days).
We calculate the residuals (abnormal returns) as the differences between the estimated and actual returns:
ARit= Rit−ˆRit
These residuals are then used to calculate the average abnormal returns, as follows:
AARt=1NN∑i=1ARit
where AR represents the abnormal returns and N is the number of events. Finally, Student’s t-test is used to determine the statistical significance of the abnormal returns.
III. Data
This study selected data for the top 10 most lucrative sectors of the PSE based on their turnover rates, because they report dividends more often. The sectors examined include engineering (76),[1] commercial banking (147), textile composites (180), cable and electrical products (36), food and personal care products (153), technology and communications (50), cement (109), fertilizer (104), chemicals (190), and oil and gas marketing (65). The daily closing price data for each company from 2000 to 2018 and the dates of their dividend announcements are collected from the websites of the PSE and Business Recorder. The study spans 2000 to 2018, exclusively because of data availability.
IV. Results
Table 1 reports the average abnormal returns for the 10 sectors collectively and individually around dividend announcements. Returns on day 0 refer to abnormal returns on the event day, whereas days with negative and positive represent pre- and post-announcement days, respectively. If a dividend declaration is statistically related to abnormal behavior in returns surrounding the announcement date, this behavior ought to be reflected in the estimated regression residuals for the event windows of the selected sectors.
Table 1 shows that, on the event day, as well as immediately after the dividend announcement day, the average residuals (Average Abnormal Return) of all the sectors are statistically significantly positive. The possibility of earning abnormal returns thus dissipates after one day of dividend announcements on the PSE. These results show that stock prices adjust after dividend announcements on the PSE, and, apparently, this adjustment takes only two days to restore the prices that denote the PSE as an inefficient market, since the new information is not quickly integrated into stock prices.
Similarly, however, the average abnormal returns of the individual sectors exhibit evidence of insider trading before announcements, with a significant impact on the event date; ambiguity can thus be observed in the speed of adjustment of some sectors. For example, the technology and communication, oil and gas manufacturing, food and personal care product, and commercial bank sectors have strong indications of insider trading preceding dividend declaration dates. Moreover, two sectors also show AAR to have a statistically significant value on the event day; nevertheless, stakeholders of these sectors have no possibilities to earn higher profits past the dividend announcement day, and stock prices resume normal values immediately afterward. However, the values of AAR in the chemical and cement sectors are significant just before and after the announcement day, but nonsignificant on the event day, which makes it difficult to determine the speed of adjustment of stock prices in these sectors. Similarly, the textile, engineering, and cable and electric product sectors support the dividend irrelevance hypothesis, given nonsignificant values of AAR on the event day. Nevertheless, the fertilizer sector shows that, after a dividend announcement, the average returns on securities immediately resume their normal value, which indicates that this sector is efficient, because no insider trading is evident in this sector and investors cannot earn abnormal profits after dividend announcements.
V. Conclusion
This study assesses the rate of adjustment of stock returns by empirically examining stock price behavior in response to new information in the form of dividend declarations in the 10 most lucrative sectors of the PSE. The results show that the PSE is a semi-strong efficient market in the sense that stock prices do not adjust rapidly to new information. Nevertheless, stock prices converge to equilibrium quickly on the PSE, and the values of AAR present evidence of price reversal one day after the announcement. Moreover, the values of AAR in some sectors support the dividend irrelevance hypothesis. In a nutshell, it can be inferred that, in some PSE sectors, abnormal profits around announcements are possible. Future studies should build on our research idea by extending the empirical model to a) include more market risk factors, b) evaluate the role of macroeconomic risk factors, and c) study other potential trading strategies.
The number of dividend announcements is written in parentheses.