I. Introduction
The COVID-19 pandemic has led to unimaginable deceleration and repercussions in international trade. The pandemic that originated in China disrupted global supply chains and caused severe contractions in trade. Most developed and developing economies are dependent on Chinese intermediate inputs. Many felt that China would lose its label of “global factory,” potentially opening doors for other Asian economies. China’s preeminence in global production and its role in trade are thoroughly discussed in previous works (Baldwin & Freeman, 2021; Baldwin & Tomiura, 2020).
A year after the first wave of COVID-19, in 2020, trade growth was marred by regional disparities. The COVID-19 pandemic continued to pose a threat to many countries, and the second wave of infections blocked recovery. World trade recorded a drastic reduction of 9% in 2020, with trade in goods having slumped to 6% and trade in services to 16.5% (UNCTAD, 2021a). Most economies suffered a significant drop in both exports and imports; however, an exception has been East Asia. China’s trade pattern and growth were notably different from those of the rest of the world. Although Chinese exports fell in the first quarter of 2020, they regained their loss and stabilized by the second quarter, rebounding strongly and completely in the third quarter (UNCTAD, 2021b). Given these facts and the COVID-19 pandemic, the present paper examines whether China has maintained its lead, or central, position in the world trade network.
Studies on the effects of COVID-19 have emphasized different aspects of the economy, such as the financial markets (Ali et al., 2020; Narayan et al., 2021), exchange rates (Iyke, 2020), stock markets (Haroon & Rizvi, 2020), and the global trade network (Kiyota, 2021; Vidya & Prabheesh, 2020). Previous work (Vidya et al., 2020) have studied trade interconnectedness among countries before and during the onset of the COVID-19 pandemic in 2020 and find a change in the structure of the trade network at the beginning of the pandemic. The present study extends the analysis to the first wave of COVID-19 and focuses especially on China’s trade predominance during the pandemic. For more details, see the in-depth literature survey on the economics of the COVID-19 pandemic by Padhan & Prabheesh (2021). Distinct from the studies mentioned, this paper focuses on the world trade network before and during the COVID-19 pandemic. Moreover, this work is one of very rare attempts to analyze the reasons for China’s preeminence in world trade, even during the pandemic.
Our approach to analyzing the research issue is as follows. We apply trade network analysis to the top 25 global merchandise trading countries in 2019, that is, before the onset of the pandemic, and in 2020, that is, after the first wave. First, we find the position of each country in terms of the center and periphery of the network. Second, we analyze if China’s preeminence in the world trade network has changed due to the pandemic. Third, we analyze how the pandemic has affected China’s trade pattern, that is, whether it is more intra-regionally or inter-regionally inclined. We then apply bilateral trade intensity measures (intraregional import and export preferences) to China and 15 of its trade partners.
Our empirical findings are as follows: 1) The positioning of the countries in the world trade network has not changed since the first wave of the pandemic; 2) trade interconnectedness, connectivity, and density among countries were drastically reduced in 2020 compared to 2019; 3) China still occupies its central position, even after surges in the pandemic and resultant crisis; 4) China’s exports surpass its imports, and it was one of the largest exporters in the world in 2020; and 5) China’s trade preferences have shifted from inter-regional to intra-regional.
II. Data
To analyze the trade network, we use the top 25 countries in terms of global merchandise trading; the United States, Germany, China, the United Kingdom, France, the Netherlands, Italy, Belgium, Spain, Japan, South Korea, Hong Kong, Singapore, Switzerland, India, Canada, Malaysia, Mexico, Vietnam, Austria, Brazil, Ireland, Poland, Portugal, and Thailand. We obtain bilateral trade data from the CEIC Data and World Trade Organization databases. To analyze China’s trade pattern, we examine its top 15 bilateral trade partners: the United States, Hong Kong, Japan, Vietnam, South Korea, Germany, the Netherlands, the United Kingdom, India, Taiwan, Singapore, Malaysia, Australia, Russia and Thailand.
III. Methodology
This study uses two methods for its analysis: a) network analysis and b) bilateral trade intensity indices.
A. Trade network analysis
A network is a mathematical description of a system at a given time in terms of nodes and links (Fagiolo et al., 2010). Every node has an in-degree and an out-degree in a network, where the out-degree is the number of outgoing edges and the in-degree is the number of incoming edges. The degrees represent trade flow. Correspondingly, the centrality parameters include closeness, eigenvector, betweenness, and density centrality. Closeness and eigenvector centrality indicate interconnectedness and connectivity, respectively. Similarly, betweenness shows the extent of regionalization. In comparison, network maps are only graphical representations. It is therefore worth adhering to the parameter results for comparisons of two periods.
We construct the network by preparing an undirected network matrix with N = 25 countries for 2019 and 2020. To estimate the network analysis of raw bilateral trade data, we calculate an export matrix in which the value of every cell is the mean export of country A to country B and the mean import of country B to country A.
B. Bilateral trade intensity indices
The bilateral trade intensity indices, indicating revealed trade preferences (RTPs), are derived from intraregional import preferences and intraregional export preferences. For a detailed discussion of this topic, see Vidya et al. (2020).
We analyze the bilateral trade intensity between countries through the RTP variable, RTP, which is derived from intraregional import preferences and intraregional export preferences. Lapadre & Tajoli (2014) define RTP as the relative bilateral trade intensity, the ratio between the difference and the sum of “homogeneous” bilateral trade intensity and the extra-bilateral trade intensity index :
RTPij=(HIij−HEij)/(HIij+HEij)
where
HIij=Sij/Vij=(Tij/TiW)/(TOj/TOW),HEij=(1−Sij)/(1−Vij),
with as partner country ’s share of reporting country ’s total trade and as its share of world trade. Similarly, is the total bilateral trade between reporting country and partner country is the trade between reporting country and the world, is the trade between country and the world, and is the total world trade. The index ranges from −1 (no bilateral trade) to +1 (only bilateral trade), and the case in which it is equal to zero is called geographical neutrality.
IV. Empirical findings
A. World trade network
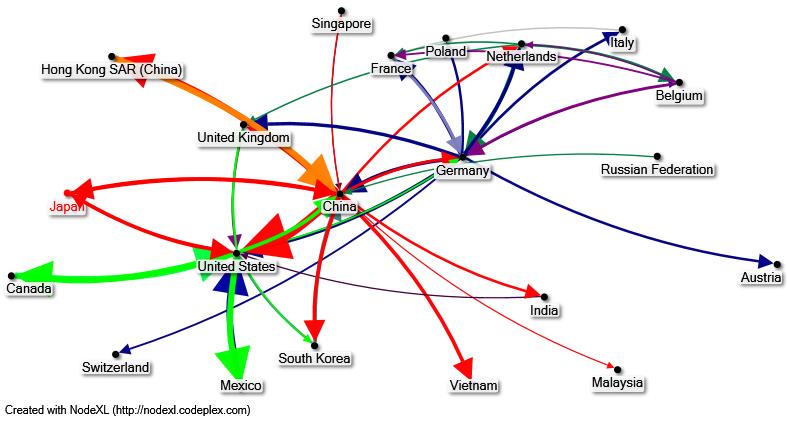
Figures 1 and 2 (panel A) show the network maps for 2019 and 2020, respectively. Figure 1 shows that China, the United States, and Germany are the major traders in the world, since they are central. China is at the map’s epicenter, implying its global leadership during 2019. The thicker arrow lines denote strong trade flow during 2019.
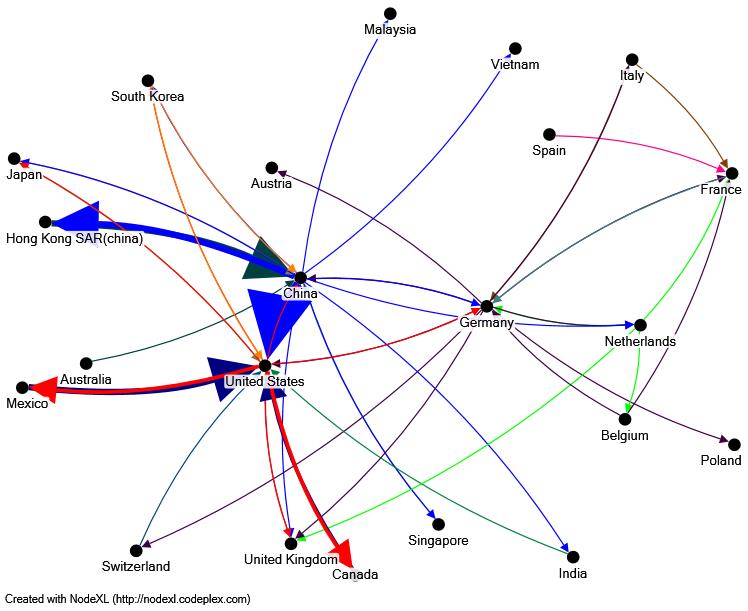
Similarly, Figure 2 shows the trade network map for 2020, the year after the first wave of the pandemic. One similarity with the previous year, 2019, is China occupying the center. This result implies that the outburst of the pandemic did not change the position of the countries in the world trade network. During 2020, trade inflows and outflows among the countries were reduced. The arrows are thinner and less interconnected, and the only thick bilateral trade flows are for China, the United States, and Hong Kong.


Table 1 reports the network centrality parameters. These results show that overall trade density declined drastically, from 0.117 in 2019 to 0.0106 in 2020, which indicates that the pandemic severely impacted countries’ trade flows and connectivity. The total degree (trade flows) for each country is almost the same in both years, indicating active trade flows. However, the measure of closeness, represented by the geodesic distance between countries i and j, has increased compared to 2019. This finding shows that the pandemic spread has increased geodesic distances between countries, that is, closeness has been reduced.
The measure of eigenvector centrality indicates how important a node is to the nodes around it; that is, it is a measure of interconnectedness. Compared to 2019, there is a marked reduction in this measure in 2020. Similarly, betweenness is a measure of dependency. The values of betweenness have dropped for the United States, Germany, China, the United Kingdom, Italy, Belgium, and India, indicating that pandemic has reduced trade integration.
B. Trade intensity measures of China and its partners
The trade intensity indices calculated for China and its partners show that China’s export preferences are rising, and its import preferences are falling. Before the pandemic, in 2019, China exhibited strong import and export preferences in terms of the United States, Hong Kong, Vietnam, South Korea, the Netherlands, India, Singapore, and Thailand. However, after the pandemic spread, China’s trade preference shifted to East and Southeast Asia. Table 2 shows the country’s export preferences in 2020 with regional partners such as Hong Kong (0.70), Japan (0.32), Vietnam (0.22), South Korea (0.31), and Singapore (0.31). The respective RTP values also show that trade with regional partners is positive and trade outside the region is either reduced or negative. Hence, we can summarize that China’s trade pattern shifted toward intraregional after the first wave of COVID-19. Increasing trade and an intraregional trend for China are also found in 2020 (Harding, 2020; Nicita & Razo, 2020). This regionalization trend has helped China maintain its preeminence in world trade.
V. Conclusion
Although the COVID-19 pandemic originated in China in December 2019 and impacted the country’s trade, China’s relative position in trade network has not drastically changed. The network parameters show a considerable reduction in trade density within a year. Similarly, trade integration among the countries analyzed was greatly reduced, and the geodesic distances between them has increased. China’s trade pattern changed in favor of intraregional trade after the pandemic spread in 2020. China’s RTPs toward regional partners shifted toward East and Southeast Asia, becoming negative for its other trade partners. This could be the reason for China’s preeminence in world trade, even when the world is only slowly recovering from the restrictions of the COVID-19 pandemic. During this crisis, countries should initiate and promote international cooperation and reciprocity. Eliminating undue restrictions and barriers to trade will help revamp global supply chains and smooth the flow of goods and services.