
I. Introduction
This paper provides direct evidence on the economic impact of the Movement Control Order (MCO), drawing upon Malaysia’s experience. The objective of this paper is to use the gross domestic product (GDP) and its components to measure the immediate impacts of the MCO and the COVID-19 pandemic on aggregate components of Malaysia’s GDP and counterfactual countries.
The current literature on COVID-19’s effects has highlighted a number of issues (Padhan & Prabheesh, 2021). Choi (2020), Iyke (2020), Barro et al. (2020), and Jordà et al. (2020) all find that the COVID-19 pandemic reduced output and growth: consumption and investment declined (Liu et al., 2020; Maliszewska et al., 2020; Yu et al., 2020), and COVID-19 has had a negative impact on firm and industry performance (Gu et al., 2020; Qin et al., 2020; Xiong et al., 2020).
The Malaysian government began to implement draconian measures, known as MCO, to contain the spread on March 18, 2020. The COVID-19 outbreak has had a serious impact on Malaysia’s economy. The Malaysian government estimates that the country’s GDP declined by 0.8% to 1.2%, or from RM 10.8 billion to RM 17.3 billion. The decline of the GDP has been blamed on the MCO, which was imposed at various intensities since March 18, 2020 (Department Of Statistics Malaysia Official Portal, n.d.). Since these harsh measures were not undertaken by many other countries in combating the COVID-19 pandemic, the situation provides an opportunity to study the impact of the measures on the GDP and its component compared to other Southeast Asian countries, both before and after the MCO’s enforcement. This study seeks to illustrate the impact of the MCO on the GDP and its components in Malaysia’s case, compared to a group of Southeast Asian countries.
To date, there has been a lack of research on the MCO’s impacts on the GDP and its components in relation to the occurrence and severity of the COVID-19 pandemic in Malaysia. Thus, the paper’s contributions to the literature are twofold. A vast literature finds the economic consequences of diseases to be significant (Fan et al., 2016). Specifically, large-scale viral diseases have a substantial long-term impact on GDP and per capita income (Bloom & Mahal, 1997; Sachs & Malaney, 2002), human capital accumulation (Almond, 2006; Bleakley, 2007), housing prices, and the urban landscape (Ambrus et al., 2020). Given glaring concerns over the COVID-19 pandemic, economists (e.g., Atkeson, 2020; Barro et al., 2020; Hossain, 2021; Janus, 2021) have started to identify and estimate its potential economic impact.
We use quarterly aggregated data to quantify the impact of the MCO on the GDP and its components and relate it to epidemic severity, both in the cross section and over time. This paper also contributes to the debate over the MCO’s impact on the Malaysian economy regarding GDP growth and its components. Karim et al. (2020) find such measures had a negative impact on most sectors in Malaysia during the outbreak of COVID-19. Nevertheless, Karim et al. (2020) also show that the levels of key air pollutants during the MCO’s implementation were significantly reduced compared to the same periods in 2019 and 2018. Other studies find that the intervention measures had both positive and negative economic consequences. Chia et al. (2020) found that the MCO negatively affected Malaysia’s stock market indexes. However, interestingly the MCO had a significant positive influence on indexes revenues, with unfavorable consequences in terms of overseas financial risks. However, the economic impact of the MCO was equally critical for the complementary quantitative perspectives to be investigated.
This analysis is therefore necessary for two key reasons: first, to obtain insight into the early effects of the MCO on the components of GDP growth and, second, to potentially help the Malaysian government regulate economic impact policies in accordance with the crisis. This study is one of the first attempts to document the economic impacts of the MCO’s enforcement on Malaysia’s GDP and its components.
II. Data and Empirical Methodology
A. Data
Our dataset comprises quarterly country-level GDP data and data on GDP components obtained from the Asia Regional Integration Center (https://aric.adb.org/thailand/data). The components of the GDP listed in the dataset are the export of goods and non-factor service receipts, gross domestic investment, gross fixed investment, the import of goods and non-factor service payments, private consumption expenditure contributions, and public consumption expenditures, all as a percentage of the GDP, and GDP growth.
Our sample covers five Southeast Asian countries. The sample period is from the second quarter of 2011 to the third quarter of 2020, with March 18, 2020 (the date the MCO was implemented in Malaysia) defined as the policy intervention’s start. To capture a counterfactual pattern of the GDP and its components, we use the same data for four South Asian countries—Indonesia, the Philippines, Singapore, and Thailand—as the control group and evaluate their impact on the GDP and its components through a synthetic control group approach.
B. Summary Statistics
Table 1 presents the summary statistics of the GDP and its components for the countries in question. Based on the first quarter of 2020 (when the MCO was implemented), we divide the sample into two periods, the pre period and the post period, and use Malaysia as the treated country and a control group of four countries.
C. Empirical Methodology
In small-sample social comparative studies, where interventions affect aggregate entities such as countries, it is often challenging to find appropriate controls unaffected by the intervention that have characteristics similar to those of the affected unit (Abadie et al., 2010). Instead of using a single control unit, the synthetic control method (Abadie et al., 2012) uses a weighted average of a set of potential control units, to provide a synthetic control unit that more closely resembles the affected unit in terms of predictors. Here, we use the synthetic control method to construct a synthetic control unit for Malaysia to represent the figures for the expected GDP and its components. We refer to this control unit as Synthetic Malaysia. We then evaluate the impact of the MCO on the quarterly GDP and its components.
Below, we present the synthetic control method more rigorously. The concepts and notation of the method are based on the work of Abadie & Gardeazabal (2003) and Abadie et al. (2010).
We define as the value of the GDP and its components for country in period as the value of the GDP and its components if the country did not implement the MCO, and as the value if the country implemented the MCO. The impact of the MCO of country in period is formulated as follows:
∝it=YPit−YNit
We also define as a dummy variable equal to one if the country implemented an MCO, and zero otherwise. Then we can rewrite (1) as
YPit=YNit+Dit∝it
Synthetic control compares the evolution during the post-MCO period of Malaysia’s GDP growth and its components with that of a weighted combination of the measures of control countries.
III. Main Results
A. Synthetic Malaysia and the Impact of the MCO on the GDP Components
Figure 1 presents Malaysia’s actual GDP and its components versus those of Synthetic Malaysia. We also observe that the control group average does not demonstrate any similarities to Malaysia in terms of post-MCO predictors regarding GDP components. However, Synthetic Malaysia provides means much closer to those of actual Malaysia. For the pre-MCO period, there is a noticeable difference between Malaysia’s GDP and its components and the average of the control group. Compared to other countries in our control group, Malaysia’s GDP and its components are around the average during nearly the entire pre-MCO period. After the MCO, the export of goods and services drops, while that of the control group increases. Relative to the Synthetic Malaysia benchmark, Malaysia’s gross fixed investment increased after the MCO’s implementation, while that of the control group decreased. We can see that private consumption expenditures in Malaysia increased after the MCO was implemented, while it declined in the control group. Lastly, we find no divergence between the actual GDP growth rate of Malaysia and that of Synthetic Malaysia, and no substantial impact is estimated. The synthetic control very closely reproduces Malaysia’s GDP and its components for a period before the MCO.
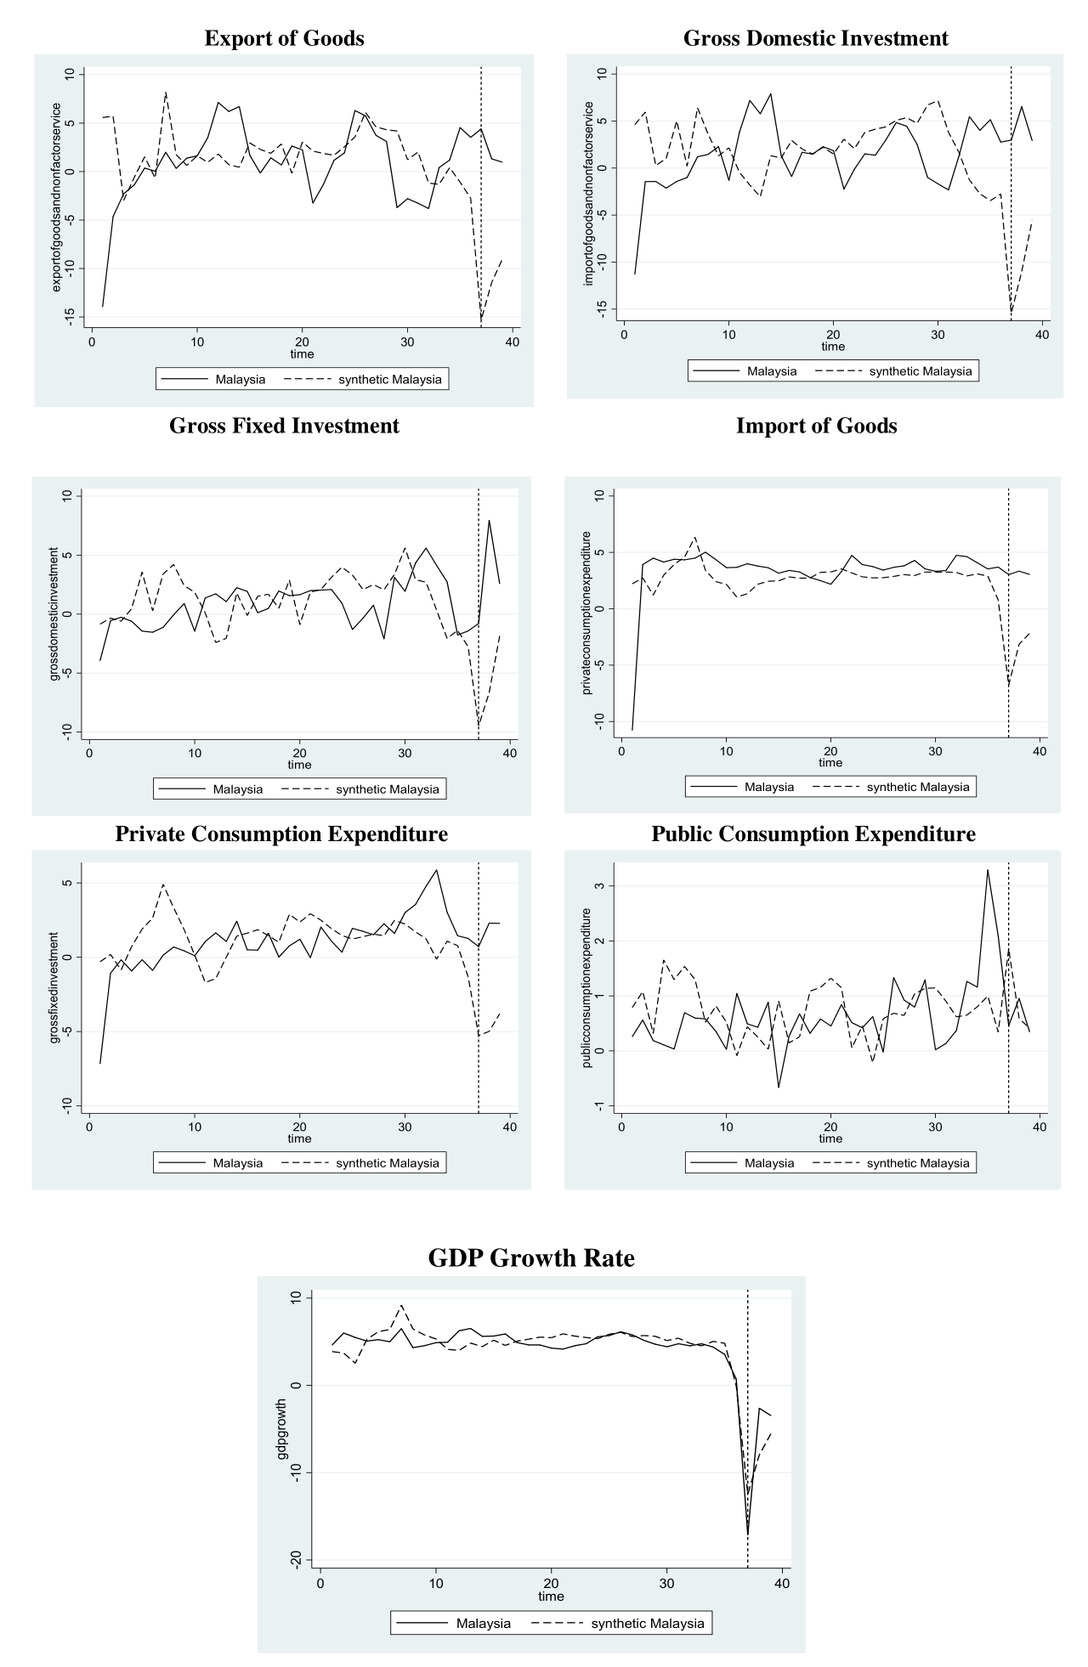
Not all components underwent a decline in output, but the biggest drop is recorded for exports. However, the sectors that increased compared to the control group, due to the government’s intervention, include gross and domestic investments and private consumption. Regardless of these differences in GDP components, the real impacts on the GDP growth are almost identical between Malaysia and the control group. This impact represents the distributional effects across the GDP components, with likely diverse impacts on the GDP growth rate. Further analysis is conducted below to determine the potential distributional impacts of the pandemic. The overall analysis confirms the negative effect of the MCO on some components of the GDP. Overall, the impact of the MCO on GDP growth does not seem to be different from that of the control group, which is partly explained by the increase in total and domestic investment, as well as private consumption.
The government of Malaysia has been compelled to enact many steps to minimize the effect of the MCO, in particular, on the nation’s economic and social activities. The central government’s spending behavior—including subsidies, public sector programs, public service wages, and healthcare benefits—has been the first instrument of monetary policy. The second instrument has been the government’s use of fiscal policies to improve the overall economy. Monetary policy was implemented to ensure that the supply of liquidity was checked at a certain point in time (Tahajuddin & Sulaiman, 2021). This policy is expected to affect and shape microeconomic activities and will inevitably have an effect on overall economic growth. Central governments are able to control overall economic growth particularly through balanced fiscal and monetary policies and instruments.
IV. Conclusion
The COVID-19 pandemic has been spreading fast across the globe. The primary focus has been necessarily on containment, treating the ill, and helping communities cope with the epidemic. The findings highlight the importance of policymakers using prompt and adequate interventions to alleviate the negative impact, especially on the more affected sectors. This result suggests that management of the public health crisis is crucial for reinvigorating the economy. The analysis indicates that the potential loss of GDP in affected countries could be significant. Therefore, governments need to offer substantial support to affected businesses and households. Furthermore, the analysis is likely to have underestimated the potential economic costs of the epidemic. Some aspects of the GDP components were captured through a synthetic control group of five Asian countries—Malaysia, Indonesia, the Philippines, Singapore, and Thailand—with a focus on Malaysia. The study finds that GDP and its components help the government to better understand the best policy to implement for economic activities.
Several policy implications can be drawn from this research. First, monetary expansion will enhance aggregate demand and encourage businesses to invest more. Subsidizing corporate investments and establishing public investment programs are examples of government measures that could encourage investment. Second, to cope with the health emergency caused by COVID-19, traditional macroeconomic policies must be grouped into relief, recovery, and international coordination policies. Third, the Malaysian government should take a number of steps to reduce the impact of the MCO’s enforcement, particularly on the country’s economic and social activities. Through well-balanced fiscal and monetary policies and instruments, central governments can manage overall economic growth. This will have an impact on and shape microeconomic activities, as well as economic growth, in general. Future studies could focus on a detailed review, and a quantitative study should be undertaken in this field.