
I. Introduction
This paper explores the impacts of diverse policy uncertainty indicators on the stock returns of Asia-Pacific countries (APCs). We trace the transmission of the following global uncertainty indices: US stock market uncertainty (using the Chicago Board Options Exchange Volatility Index, or VIX), an important source of volatility for the Asia-Pacific markets (Li et al., 2021); macroeconomic policy uncertainty (using Global Economic Policy Uncertainty, or GEPU; see Baker et al., 2020); and uncertainties due to social unrest and political tensions (geopolitical risks, or GPR; see Caldara & Iacoviello, 2018). Based on asset pricing theory, we expect the impacts of these global uncertainty shocks to hit APC stock markets via the cash flow channel through their effects on macroeconomic fundamentals, including investment and consumption expenditure (Phan et al., 2021).[1]
This paper contributes to the growing number of studies that are limited to impact analyses or the macroeconomic effects of policy uncertainty indicators (e.g., Gupta et al., 2020; Narayan & Bannigidadmath, 2015; Salisu & Adediran, 2020). For robust results, we split the Asia-Pacific region into advanced and emerging stock markets and apply homogeneous panel vector autoregressive (VAR) models to each group based on the orientation of Abrigo & Love (2016). These allow us to conduct comprehensive analyses across classes of stock markets in the region, analyses across classes of uncertainty shocks, and robust analyses with real and nominal stock returns.
The remainder of the paper is organized as follows. We present the methodology for the homogeneous panel VAR models in Section II. The results are discussed in Section III. We draw the conclusion in Section IV.
II. Methodology
We construct a homogeneous panel VAR model in line with the work of Abrigo & Love (2016) to explore the effects of policy uncertainty indicators on APC stock returns.[2] Given this model’s underlying assumption that the units share a similar data-generating process, we consider the following kth-order VAR(p) model for each of the emerging and advanced APCs:
yi,t=μi+ρ∑j=1Ajyi,t−j+εi,t;i=1,2,...,N; t=1,2,...,T
where is a vector of observables for the ith cross section at time t (comprising an uncertainty indicator,[3] economic growth, exchange rate returns, and stock returns, arranged in order of exogeneity to fit the recursive nature of the panel VAR model); is an vector of lagged observables; is a vector of country-specific time-invariant effects; is an matrix of coefficients of lagged observables; is a vector of idiosyncratic disturbances; and is the variance–covariance matrix of the residuals.
The conventional least squares estimators are biased and inconsistent due to the introduction of the lagged term in the specification of Eq. (1), because is contemporaneously correlated. Consequently, we transform the series using forward orthogonal deviation:
zi,t=(yi,t−ˉyi,t)√Ti,t/Ti,t+1
The resulting generalized method of moments estimator of the matrix based on the model transformation is then
Aj=(z′HˆWH′z)−1(z′HˆWH′z)
where is the vector of original variables, is the vector of transformed variables based on the forward orthogonal deviation approach, is the mean of the original variables, is the number of future observations available for cross section i and time t, and is a positive semidefinite weighting matrix designed to maximize model efficiency.aursive structure that ensures the orthogonalization of shocks as and the variance–covariance matrix such that the impulse response functions (IRFs) for stock returns due to uncertainty shocks can be independently isolated. The IRFs are obtained from the vector moving average (VMA) representation
Φ(ℓ)=∞∑j=0Φjℓj
and the IRF parameters are described as
Φj={Ik;j=0∑jΦt−jAj;j=1,2,…;Ik=P−1∑ε(P−1)′
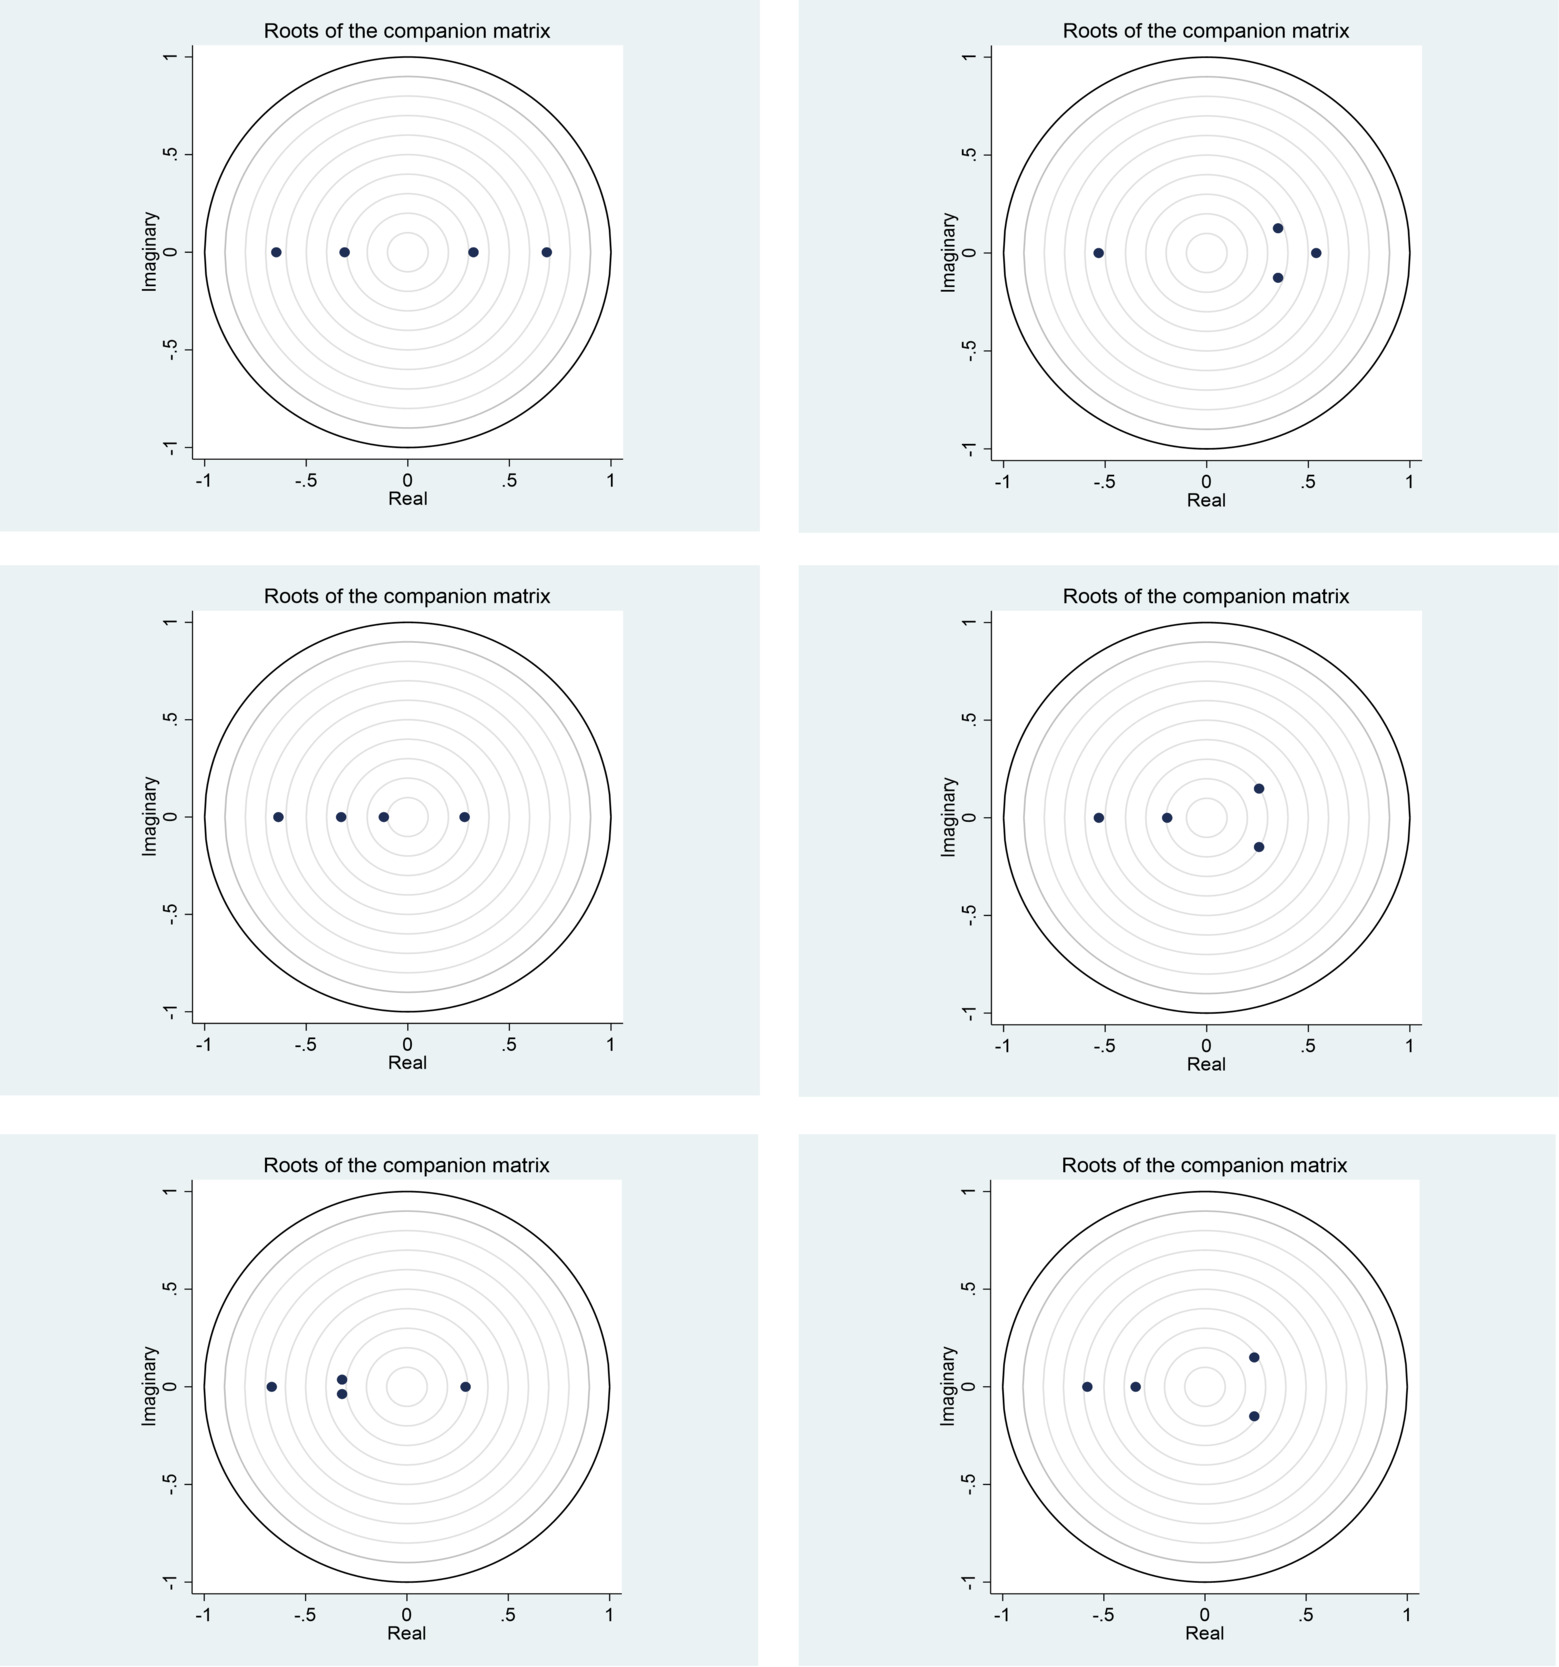
The VMA representation requires the system to be stable, in which case the eigenvalues of the companion matrix are strictly within the unit circle (see Figure 1).
We obtain three sources of policy uncertainty, including the GEPU index, the VIX, and GPR, from the Federal Reserve Economic Data database (https://fred.stlouisfed.org). The stock series and macroeconomic fundamentals—gross domestic product (GDP), exchange rate, and consumer price index for the construction of real variables—are obtained from Google Finance and the International Monetary Fund database (https://data.imf.org). All the data are quarterly, from 2005Q1 to 2020Q4.
III. Results
Table 1 presents descriptive statistics, where emerging countries have higher average nominal stock returns (2.11) than advanced economies (1.63). The reverse is the case when the stock returns are expressed in real terms to control for the role of inflation, where advanced APCs (1.22) have higher returns than emerging APCs (0.99). This result shows that we might not obtain uniform responses from the contrasting economies to shocks to the global uncertainty indicators if we consider inflation a form of macroeconomic uncertainty. As expected, the stock return variables are stationary. The diverse panel unit root techniques explored provide consistent evidence that rejects the null of the unit roots in the panels for all the series (including the uncertainty series).[4]
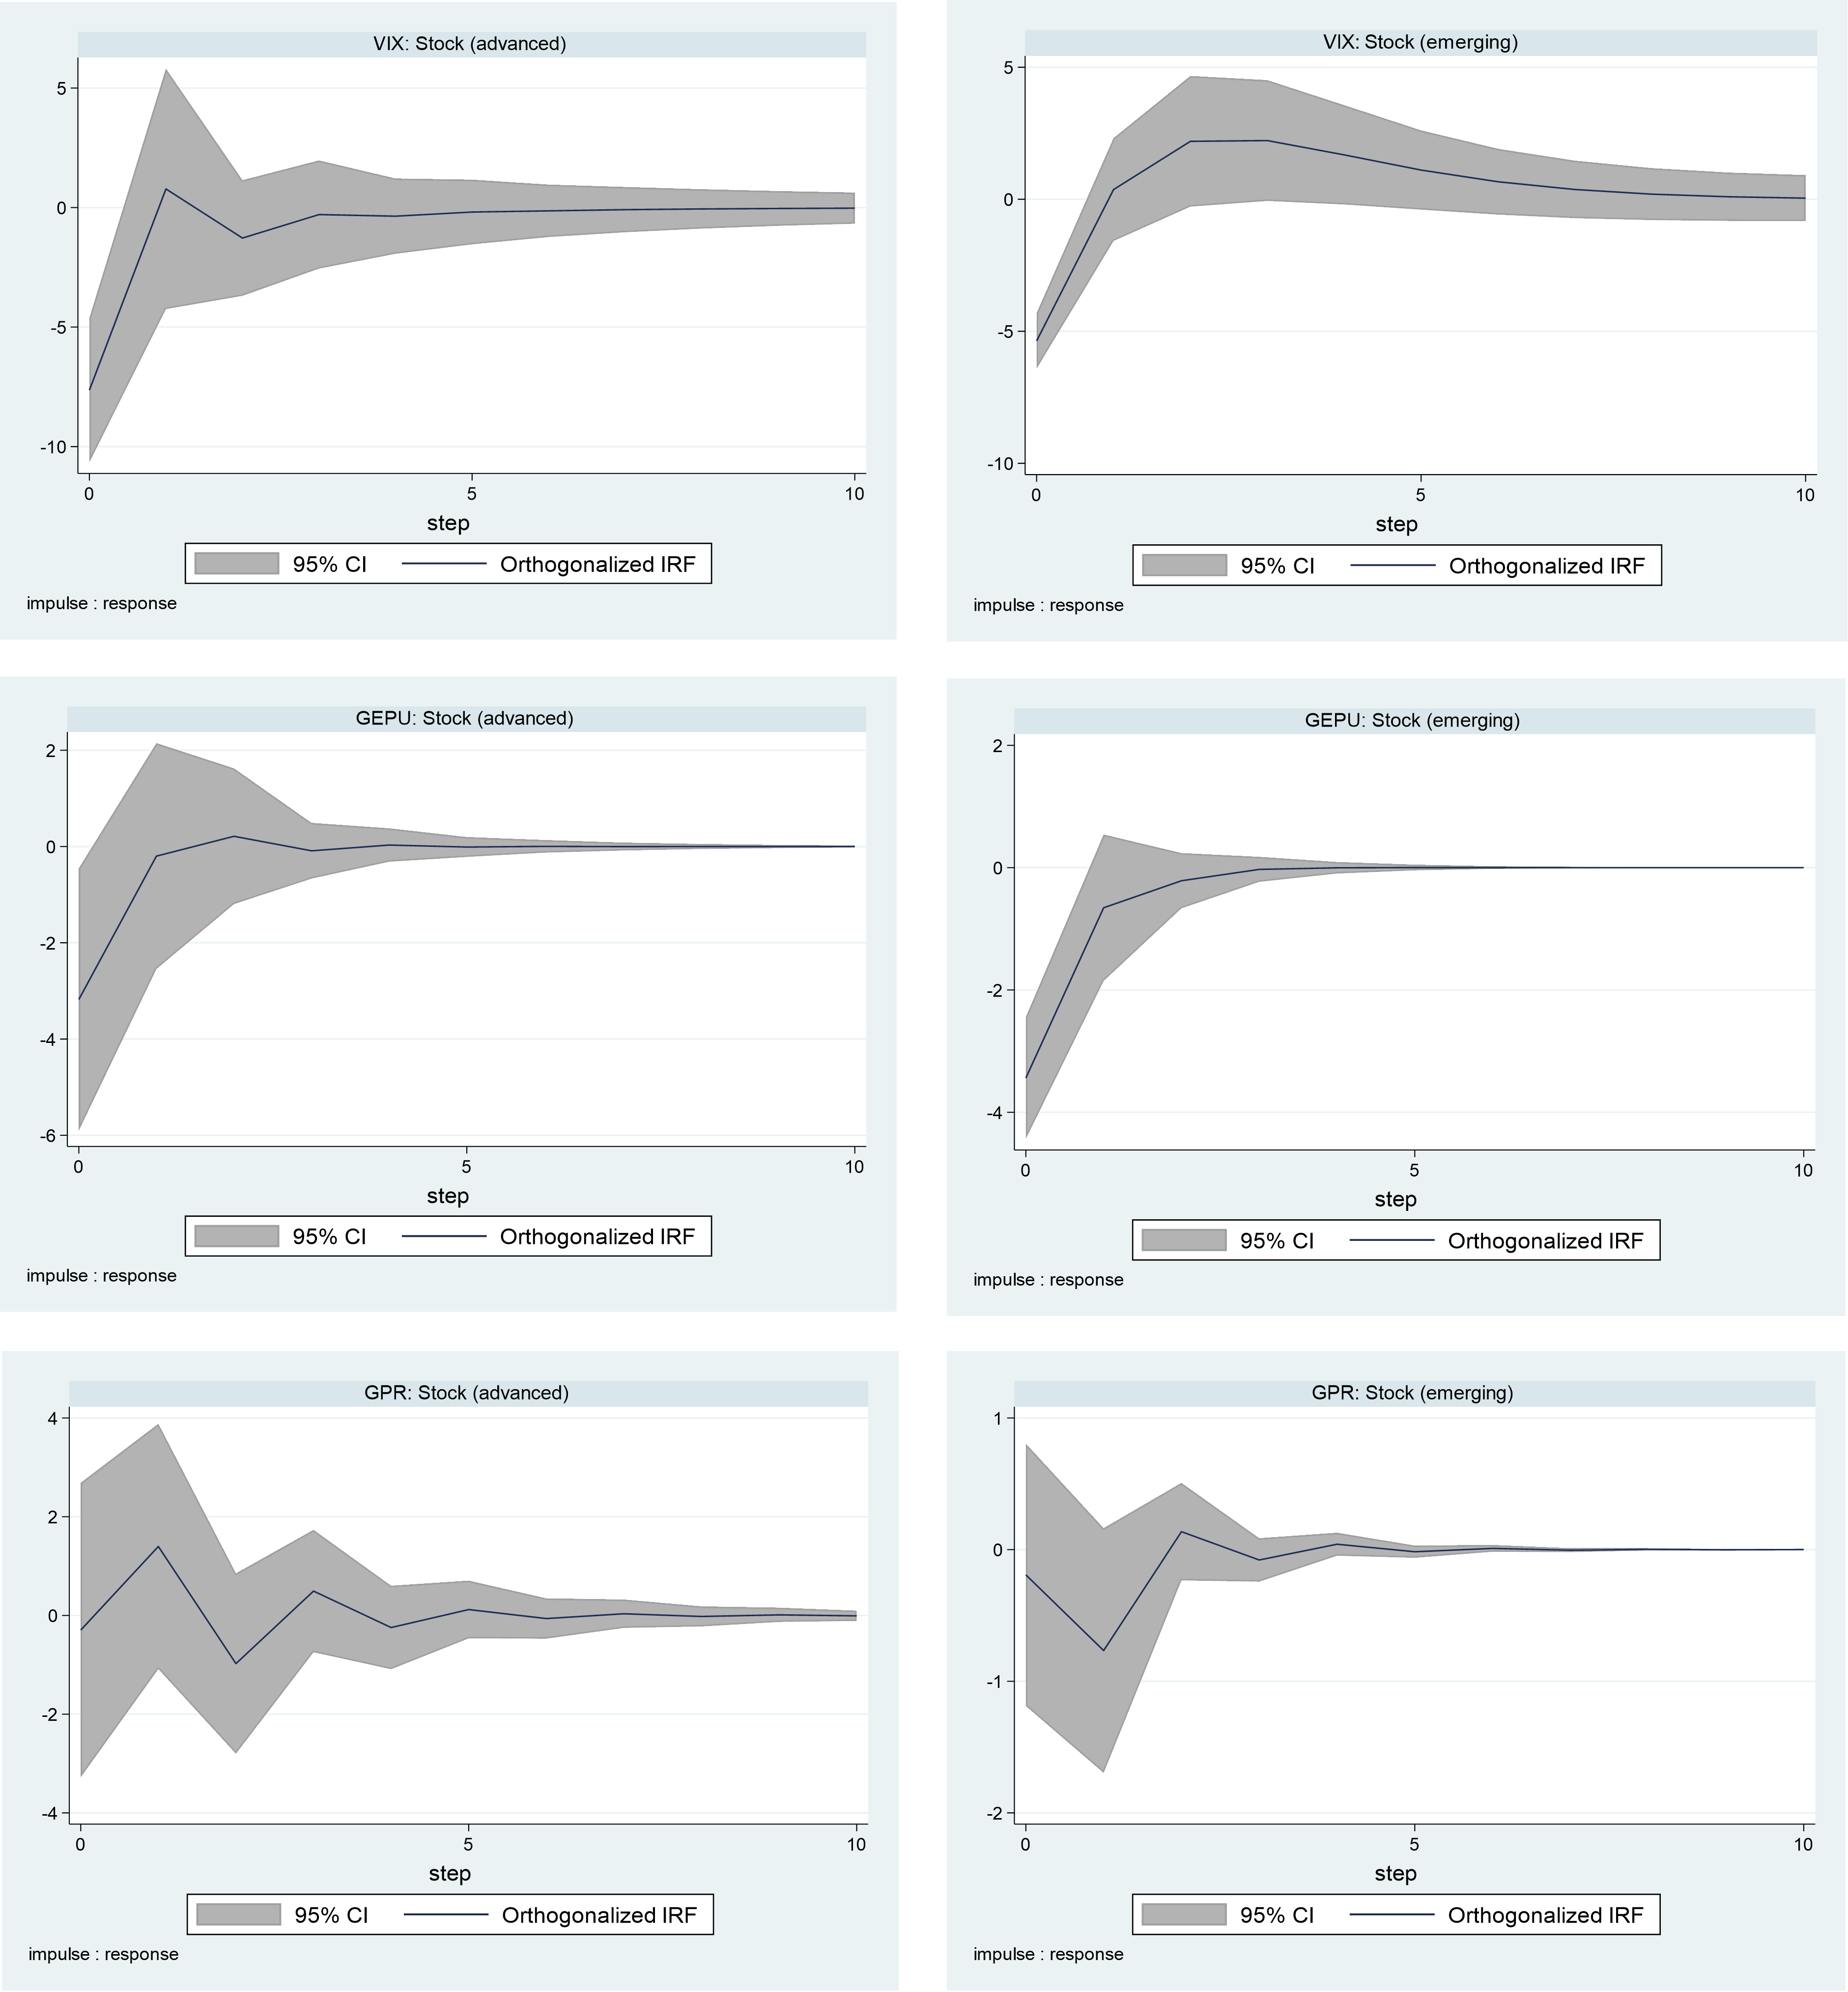
The model diagnostic tests reported in Figure 1 show that all the panel VAR models are stable, given that all the eigenvalues of the companion matrices fit within the unit circle. This result also indicates that the VAR models can be inverted with an infinite-order VMA representation to obtain the impulse responses. We obtain the orthogonalized impulse responses through the Cholesky decomposition of the shocks. This requires a lower triangular restriction, such that the contemporaneous impacts of shocks have the following order: uncertainty indicator, GDP growth, exchange rate returns, and stock returns. In the identification of the impacts of uncertainty shocks on the nominal stock returns in Figure 2, we show that the APC stock returns generally respond negatively to shocks due to the uncertainty indices, whether emerging or advanced. The negative impact of the shocks is, however, greater for advanced APCs compared to emerging APCs.
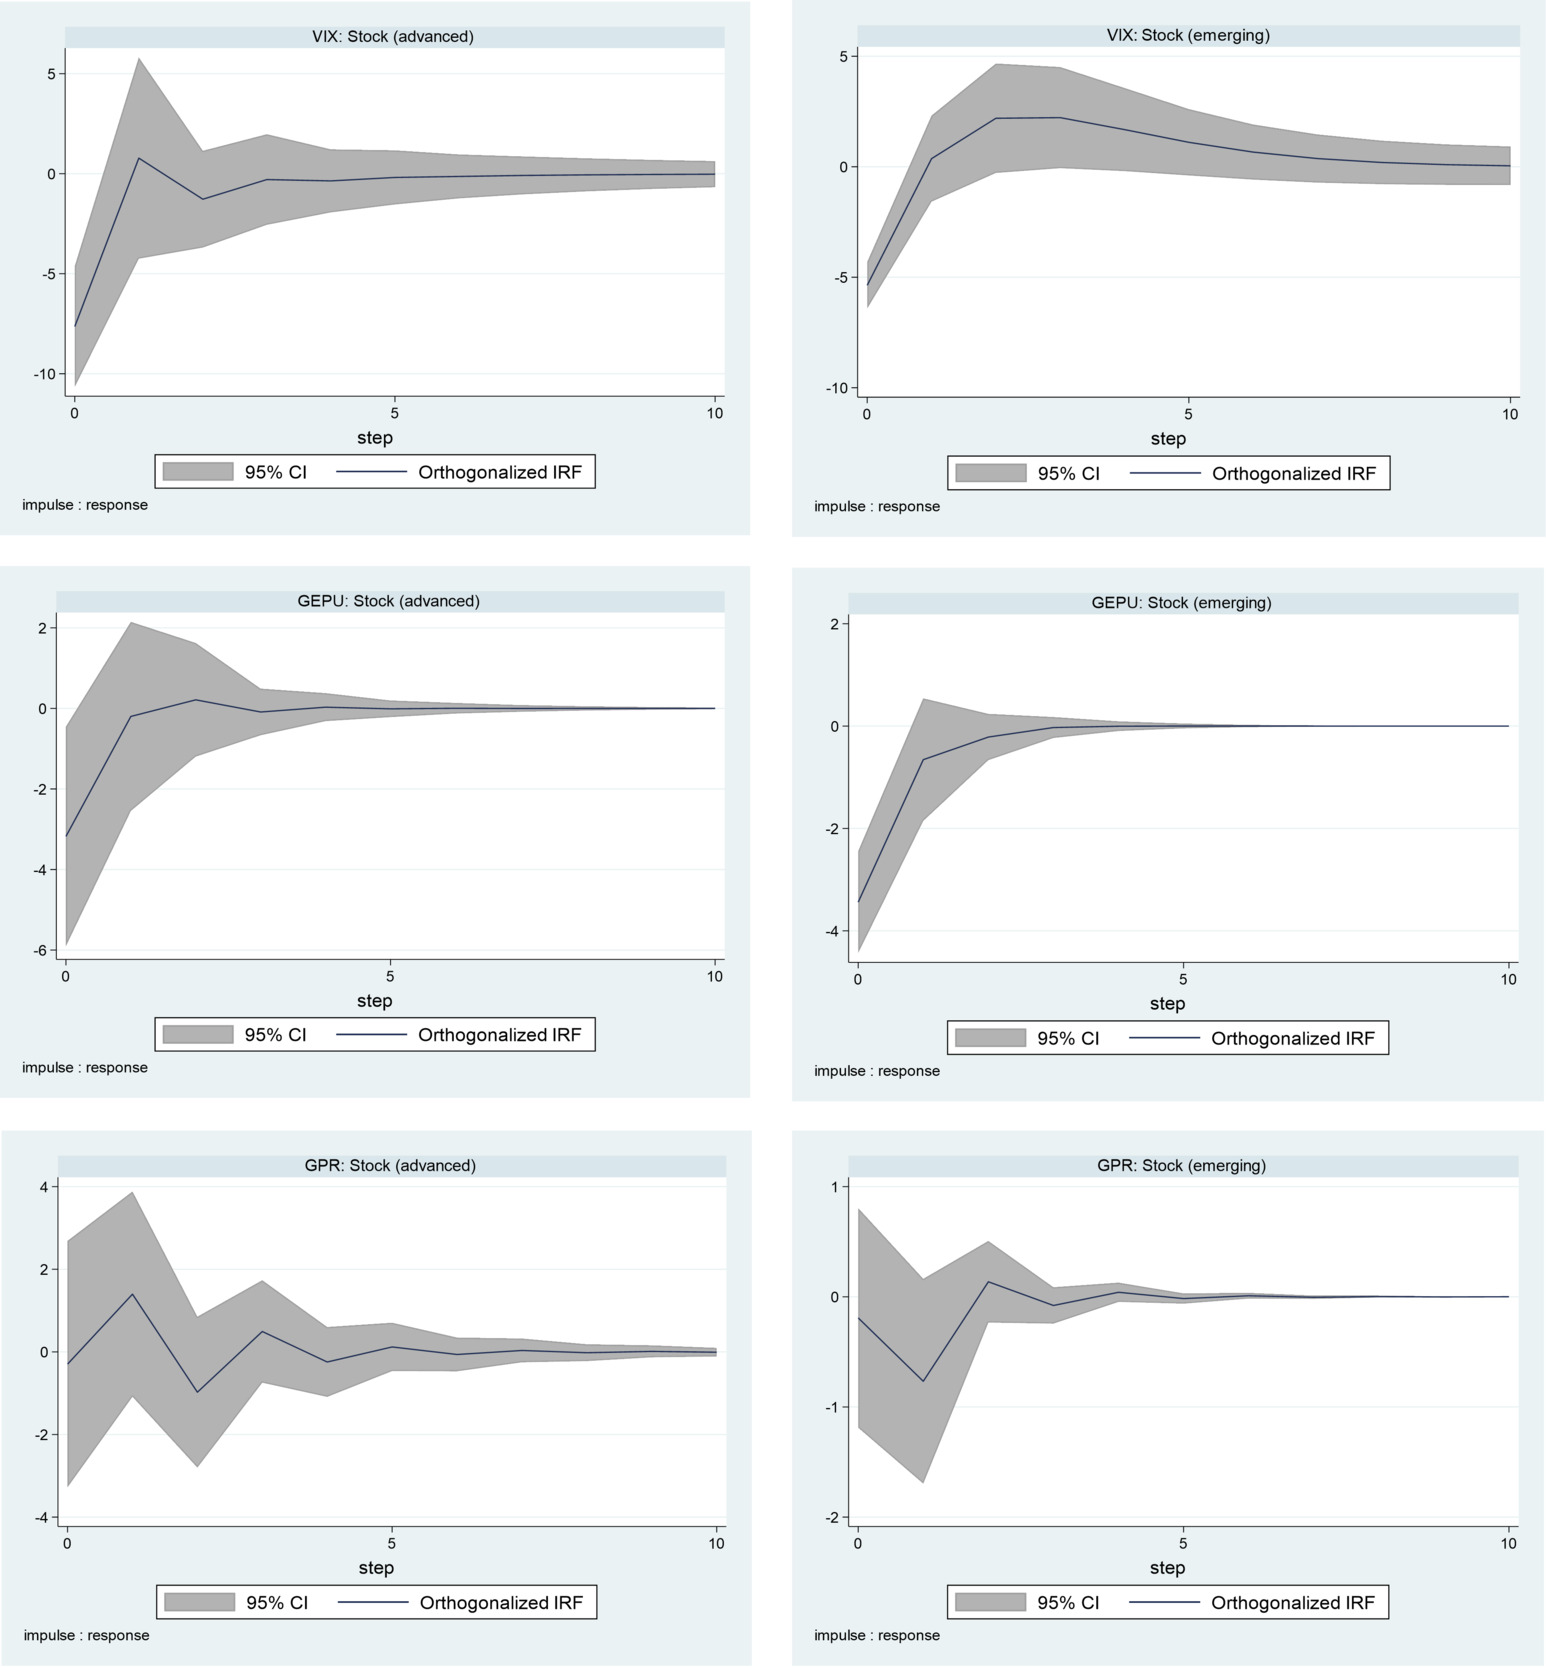
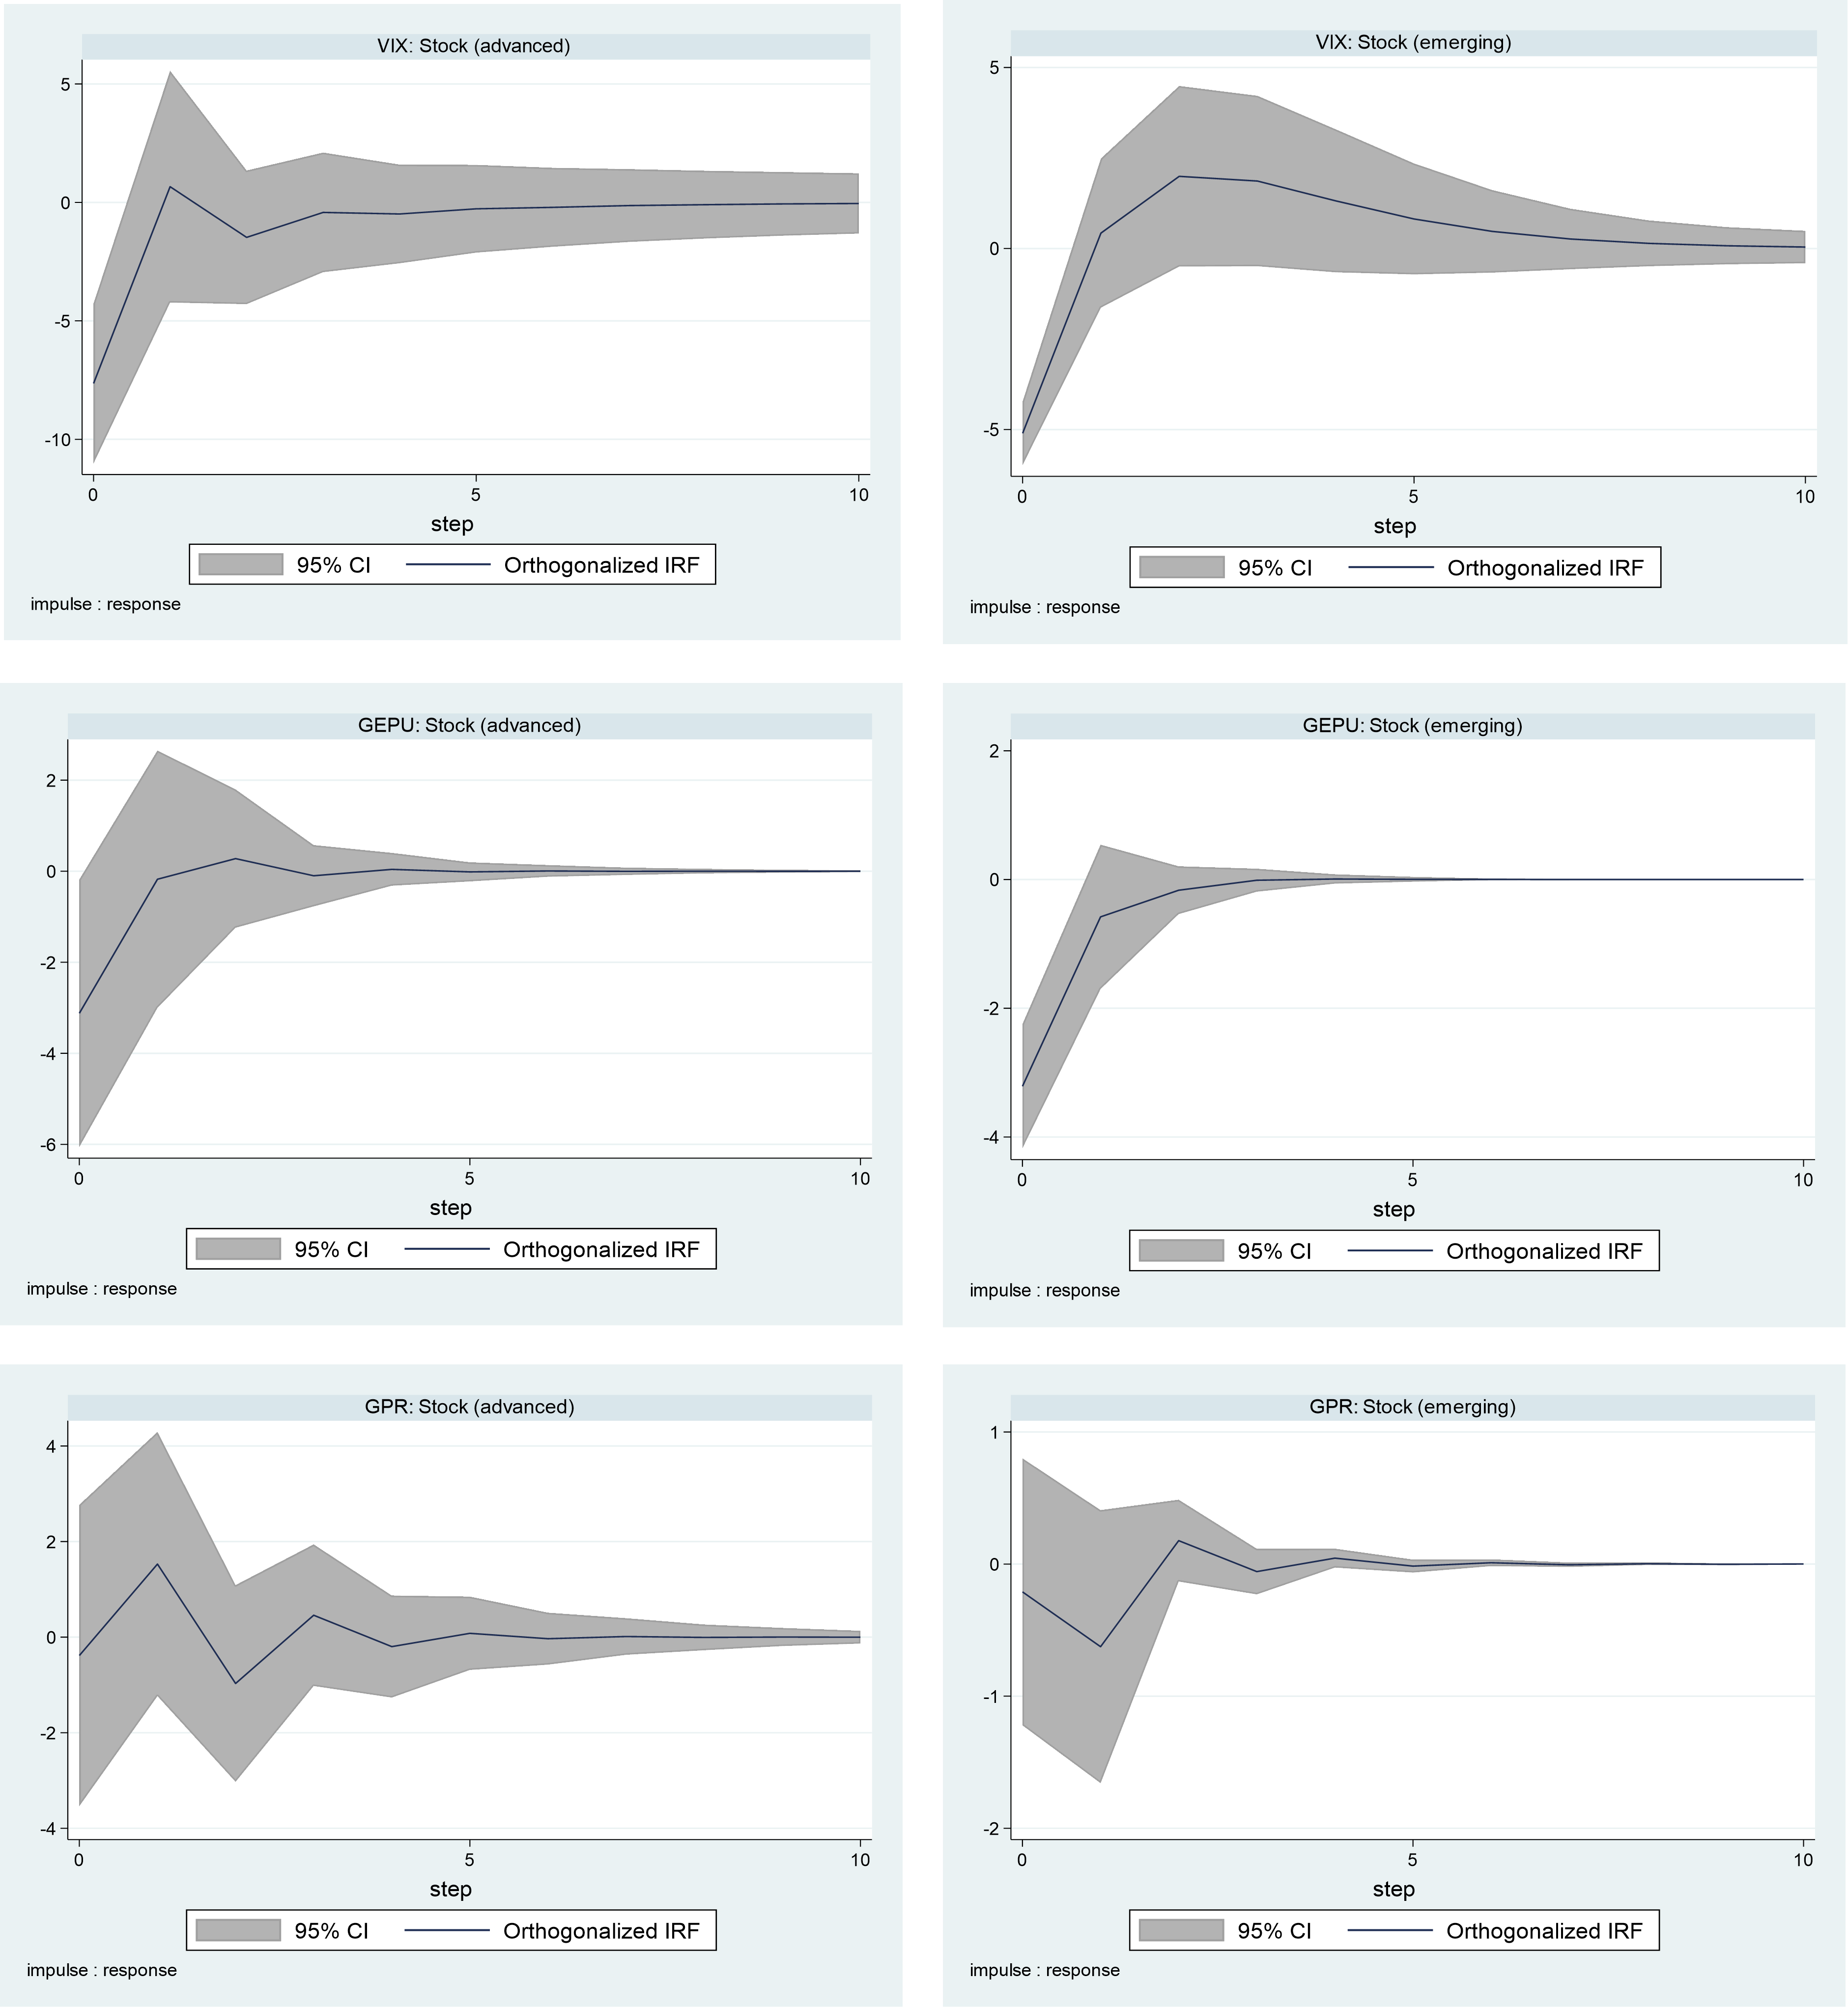
Applying figures to the impacts, we find, as expected, that the two stock return series respond more to the measure of stock market uncertainty (VIX), with advanced and emerging APC stock returns declining by 7.5% and 5.1%, respectively, to a one standard error shock to the VIX. Next is economic policy uncertainty (GEPU), where a one standard error shock leads to reductions of about 3.2% and 3.5% in advanced and emerging APC stock returns, respectively. The stock returns of APCs are less affected by GPR, as shown by the marginal reductions of about 0.1% and 0.2% in advanced and emerging APC stock returns, respectively. In addition to these magnitudes of change, the APC stock markets appear to absorb all the uncertainty shocks with time, but the impacts linger longer in advanced APCs than in their emerging counterparts. These findings are shown to be consistent in the face of robustness checks using real stock returns for the IRFs in Figure 3.

IV. Conclusion
In this study, we identify three different sources of policy uncertainty, namely, an index of stock market volatility (VIX), an index of macroeconomic policy uncertainty (GEPU), and a measure of human-causes uncertainties (GPR), including political events and terrorism. We trace the impacts of these shocks on the stock market returns of emerging and advanced APCs. This is made possible by a panel VAR model that is ideal for homogeneous cross sections and that adopts a recursive structure to isolate the impact of each of the uncertainty shocks on the APC stock returns.
We show that policy uncertainty reduces APC stock returns with a greater negative magnitude, with longer-lasting effects for advanced APCs than for emerging APCs. The findings show that investors can take advantage of the greater resilience of emerging APC stocks for diversification. We show that the stock markets are more vulnerable to financial uncertainty as defined by the VIX and then, macroeconomic policy uncertainty shocks, that is, those defined by the GEPU. The negative impacts observed for GPR are minimal, indicating that the financial markets in the Asia-Pacific region are influenced more strongly by financial and economic uncertainty indices, which APC policy makers should focus on to strengthen the financial markets. Other studies could conduct in- and out-of-sample predictability analyses with the uncertainty indicators to complement the shock analysis considered in this study.
This is theoretically plausible, because economic agents become more circumspect during turbulent times (Bloom et al., 2007) and, therefore, policy uncertainty is expected to lead to negative macroeconomic outcomes.
Due to the model’s homogeneity, there is no analysis for the full sample of APCs. The advanced APCs are Australia, Japan, Korea, New Zealand, and Singapore, and the emerging APCs are China, Indonesia, Malaysia, Pakistan, Philippines, Russia, and Thailand.
Three uncertainty indices (VIX, GEPU, and GPR) are included separately, one after the other.
Given the need for stationarity, we capture the indices in their first differences.