

I. Introduction
Several decades of economic and financial globalization have promoted economic growth (Schularick & Steger, 2010). However, globalization might also incur additional costs to the business world, since firms often face bilateral political tensions to an extraordinary extent. Yet, the impact of political tension on firms is still debatable among economists. On the one hand, sunk costs provide disincentives for firms to change their behaviors, and there is empirical evidence to support the “business as usual” theory (Davis & Meunier, 2011). On the other hand, Heilmann (2016) finds a non-negligible effect on bilateral trade. Still, very little research has gone beyond the international trade context.
In this paper, we investigate the impact on firms’ cross-border syndicated loans in the context of the recent China–U.S. trade war, since it has become increasingly important for corporations to have international capital access (Gao & Jang, 2018). We treat the initiation of the Section 301 investigations as the beginning of the China–U.S. trade war and study its impact on Chinese firms’ cross-border borrowing from U.S. syndicates. Our triple difference-in-differences (DDD) estimation results show that both the aggregate loan amount and the number of loan initiations made by the Chinese borrower–U.S. lender pairs were particularly affected. The reduction of the magnitude was similar to that of other economic and non-economic crises, such as the 2008 global financial crisis and the Brexit vote in 2016 (Caporale et al., 2018; Tobias et al., 2019).
Since the observed reduction could be driven by either the demand (borrowers) or supply (lenders) sides, we analyze the dominant force by investigating the change in the deal-level equilibrium interest rate. It is found that the equilibrium interest rate for Chinese borrower–U.S. lender pairs increased significantly compared to other pairs after the shock, indicating that the U.S. lender supply mainly dominates the contraction. We also show that the loan maturities of the Chinese borrower–U.S. lender pairs have increased significantly. Moreover, we observe that these China–U.S. pairs have been more likely to form secured loans following the start of the trade war.
This research contributes to the literature in several ways. First, our work relates to a growing literature concerning the impact of political tensions on cross-border economic exchanges. That research has mainly focused on international trade relationships using aggregate-level data (Che et al., 2015; Glick & Taylor, 2010; Heilmann, 2016; Martin et al., 2008), and we shed new light on firms’ financing behavior by looking at their international borrowing utilizing facility-level data.
Second, this research concerns the emerging strand of China–U.S. trade literature. Amiti et al. (2019) measure the prices and welfare effects on U.S. consumers, and Fajgelbaum et al. (2019) conclude that workers from the tradable sector in Republican-dominated counties have suffered the most during the trade war. In contrast, we investigate the effect on China–U.S. business pair through the lens of international borrowing.
The remainder of this paper is organized as follows: Section II discusses the institutional background of the U.S. 301 investigations and describes the data. Section III lays out the empirical frameworks and reports the main results. Section IV presents the robustness checks. Section V looks into additional deal-level aspects. Section VI concludes the paper.
II. Institutional Background, Data, and Summary Statistics
A. Institutional Background
The fog of the China–U.S. trade war arose in late 2017. The Office of the United States Trade Representative (USTR) initiated an investigation under Section 301 of the Trade Act of 1974 on August 14, 2017. It claimed that China’s acts, policies, and practices related to technology transfer, intellectual property, and innovation harmed U.S. commerce. On March 23, 2018, the USTR declared it was imposing 25% tariffs on $3 billion of Chinese goods based on the results of its Section 301 investigation involving high-tech industries, such as the aerospace, information technology, and automobile industries. In response, China imposed equivalent tariffs on U.S. goods the same day. The trade war persisted and escalated until late 2019.[1]
Stock market indices suffered after the unanticipated Section 301 investigations. The Shanghai and Shenzhen Stock Exchange indices fell 24.6% and 33.2% in 2018, respectively. During the same period, the Standard & Poor’s 500 index lost 300 points (an 11% loss in market value). Moreover, the Dow Jones Industrial Average Index declined by 0.56% compared to 2017. The sharp drops in key indices reflect investors’ rising concerns about the political tension.
B. Data Source
We obtained loan data from the Thomson Reuters LPC DealScan database, which includes detailed records of global loan tranches. The DealScan database contains reliable information on the global commercial loan market and is also a standard database adopted by the syndicated loan literature (Chava & Roberts, 2008; Houston et al., 2017; Tobias et al., 2019).
We include loans to firms from Mainland China made by foreign lenders from January 2014 till December 2019, three years before and after the Section 301 investigations. Our initial sample is at the facility level and includes borrower and lender names, their countries, and their industries. DealScan also reports details relating to loan characteristics and terms such as their amounts, pricing, maturities, and types.[2] Panel A of Table 1 provides the variable definitions and sources.
Our sample screening is as follows. First, we exclude all domestic loans (i.e., in which lender and borrower are from the same country), to obtain cross-border loans. Second, we exclude deals involving Hong Kong, Macau, and Taiwan, since these lender or borrower countries are excluded from the sample because of their unique political and cultural proximity. Third, since DealScan categorizes borrower countries according to firms’ physical locations, we exclude borrowers located in Mainland China that are the subsidiaries of foreign firms. Fourth, we remove samples that are regarded as tax havens. Finally, we exclude all financial borrower firms, according to their Standard Industrial Classification (SIC) codes.
C. Summary Statistics
We treat the incidence of Section 301 investigations initiated by then U.S. President Trump on August 14, 2017, as the beginning of our shock period. The event window spans from August 14, 2014, to August 14, 2019, which covers three years before and two years after the event.[3] Our final sample contains 2,153 loans, with 77 lender countries and 102 borrower countries. Panel B of Table 1 presents the summary statistics. The average loan amount (in natural logarithmic form) is USD 496 million, and the mean loan spread is 152.5 basis points with a 65-month maturity. The average syndicate size is five, and around 73% of the firms are privately owned and we thus cannot obtain their financial information. Over 90% of the loans with contract stipulations are secured, that is, have collaterals.
III. Identification Strategy and Empirical Results
A. Effects on Aggregate-Level Loan Issuance and Amounts
We first examine the impact of the start of the trade war at the aggregate level. To do so, we sum up the loan-level data at the lender–borrower pair level. Our aggregate-level sample of borrowerlender country pairs contains 39,270 (=102 77 5) observations. We then employ a DDD estimation that exploits (1) the time difference (before and after the shock), (2) the borrowers (whether they are Chinese firms or not), and (3) the lenders (whether the syndicate contains U.S. lenders or not). Specifically, the DDD model is as follows:
Yijt=β0+β1Postt×Chinese Borroweri×US Lenderj+ψij+θit+αjt+ϵijt
where and are the borrower, syndicate leader country, and year, respectively; represents the natural logarithm of the loan amount plus one or the number of loan issuances plus 1;[4] is a dummy variable equal to one for the post-shock period, and zero otherwise; is a dummy variable equal to one if the borrower is a Chinese firm, and zero otherwise; is a dummy variable equal to one if the syndicate leader is from the United States, and zero otherwise; is the country pair fixed effect that absorbs all time-invariant borrowerlead lender pair factors, such as country distance and colony history; and and are the borrower and lender country–year fixed effects, respectively, that capture all country-specific time trends such as gross domestic product growth and inflation. Standard errors are two-way clustered at both the borrower and lender country levels.
The results are reported in Columns (1) and (2) of Table 2. We can see both the number of loans and amounts dropped significantly after the announcement of the Section 301 investigations. Quantitatively speaking, the number of loan issuances for Chinese borrower–U.S. lender pairs reduced by 7.2% relative to other country pairs. The contraction in loan amounts for the China–U.S. pairs was over 49% after the start of the trade war, which is even more striking.
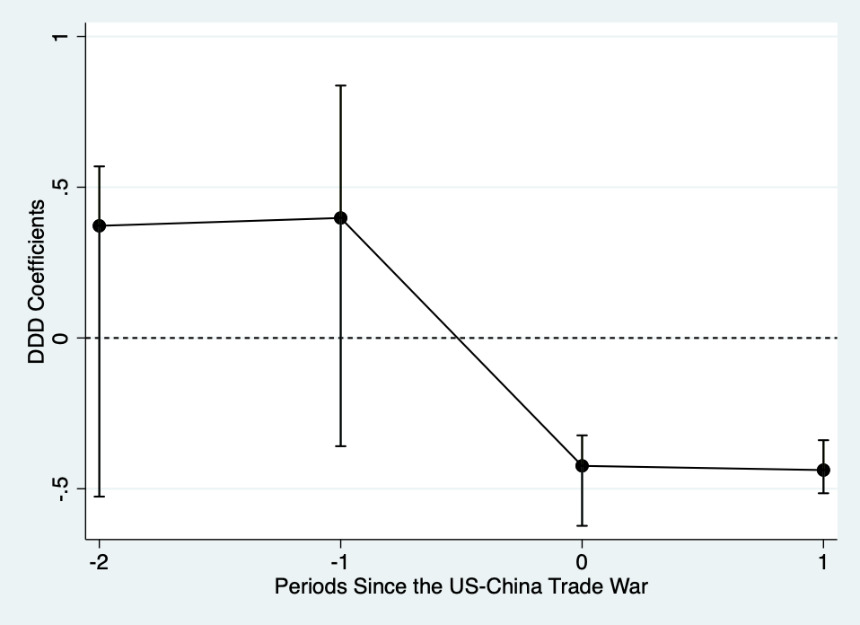
We also plot the dynamics of the DDD estimates in Figure 1. The estimates are not significant prior to the shock, which satisfies the parallel trends condition. More importantly, the DDD estimates continue to decrease after the trade war outbreak.
B. Economic Mechanism: Effects on Loan Spreads
The observed reduction in equilibrium loans could be induced by either a decrease in borrower demand or a decrease in lender supply. To determine the dominant force, we examine the change in deal-level loan spreads. Specifically, we estimate the following deal-level DDD model:
Yijkt=β0+β1Postt×Chinese Borroweri×US Lenderj+Xk+ψij+θit+αjt+ϵijkt
where denotes the loan-level variable; the deal-level dependent variable is the natural logarithm of the loan spread; and is the loan-level control variable, including the loan amount, syndicate size, nominal exchange rate, and borrower firm industry fixed effects at the two-digit SIC code level.[5] The other variables and standard errors are defined similarly as for Eq. (1).
The empirical result in Column (3) of Table 2 indicates that the loan spread between China–U.S. pairs increased significantly after the start of the Section 301 investigations. Combining the loan amount reductions, we conclude that the total reduction is mainly driven by the credit supply side (i.e., U.S. lenders) rather than the demand side, since borrowers always desire a low loan rate to cut costs, while lenders favor raising the interest rate to earn benefits.
IV. Placebo Test
Since most borrowers are private firms and their financial variables are not available, there unobserved omitted firm-level variables could be driving our baseline results. To address this issue, we follow Chetty et al. (2009) and conduct a placebo test. Specifically, we randomly assign a treatment group (i.e., Chinese borrowers and U.S. lenders) for all the deals and thus construct a new treatment group. Next, we re-estimate Eqs. (1) and (2) based on this falsified sample. Specifically, by Eq. (1), the estimated coefficient is:
^β1random=β1+∂×Cov(China−USijt,εit|D)Cov(China−USijt|D)
where contains all the control variables and fixed effects. When this means that the estimated coefficients will not be biased.
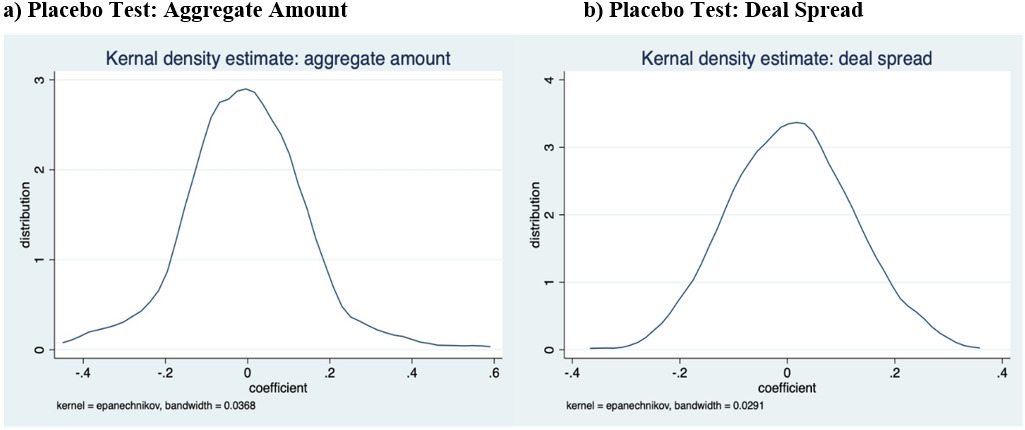
We repeat this process 500 times and obtain a vector of falsified estimated coefficients Finally, we plot the density curves (i.e., aggregate amounts and deal spreads), as shown in panels (a) and (b) of Figure 2. The curves closely follow a normal distribution, and our truly DDD coefficients are far from them. Thus, the placebo test validates our identification assumption, and the omitted firm-level variables do not contaminate the baseline results.
V. Discussion: Additional Deal-Level Analysis
We further analyze whether the China–U.S. pairs are more likely to form secured loans after the start of the trade war and the change in loan maturities. We employ the settings in Eq. (2) and replace the dependent variable by Secured and Maturity, respectively.
Columns (4) and (5) of Table 2 present the results, and we find the probability of secured loans for the China–U.S. pairs increased by nearly 53% and the maturities rose by 18.4%. Our finding is consistent with the supply-driven findings, since lenders usually prefer loans of longer maturity in cross-border lending to limit credit risk under a shock (Cerutti et al., 2015). That is, U.S. syndicates would demand long maturities after the start of the trade war, since cross-border syndicated loans are typically held to maturity (Cerutti et al., 2015).
VI. Concluding Remarks
In this paper, we study the effects of the recent China–U.S. trade war on Chinese firms’ international borrowing from U.S. lending syndicates. We find a significant and persistent reduction in equilibrium aggregate loan issuances and amounts after the Section 301 investigations. Our finding suggests a supply-driven contraction, since the equilibrium interest rate rose in the wake of the shock. We also observe longer loan maturities and a higher likelihood of the formation of secured loans among China–U.S. pairs.
This study provides initial evidence of the impact of the China–U.S. trade war through the length of international syndicated loans. Our results could serve as a reference for the first phase of this unprecedented trade dispute. Future research could focus more on industry heterogeneity and decompose the total effect into tariff and non-tariff parts.
On May 9, 2019, the USTR raised tariffs from 10% to 25% on USD 2 trillion of Chinese goods. China responded in kind. In October 2019, China and the United States initiated another round of negotiations regarding economic and trade frictions.
All loans are denominated in dollars and the information is recorded upon the date of origination. Since most of our sample borrowers are private firms, we have very limited access to their financial information.
We do not include the year 2020 to minimize the confounding effect of the COVID-19 pandemic.
Since some of country pairs did not have loans in a particular year, we define these quantities as zero.
We use the nominal exchange rate, because our dependent variable is also in nominal terms. The estimation results are quantitatively similar if we use the real exchange rate instead.