
I. Introduction
Climate change is associated with an increase in global air temperature and weather extremes, and the consequences of that change (Houghton et al., 2001). Allen et al. (2015) report that the global mean temperature has increased by 0.85°C since 1880, a trend that has been accompanied by rising sea levels, ocean acidification, reduced amounts of snow and ice, altered weather and seasonality and extreme events such as severe heat, heavy rainfall and storm-surge flooding. The link between climate change and stock returns can be expressed through the flow or stock channels (see also, Salisu & Oloko, 2015).[1] Stock returns are defined by the cash flow of the company. Climate change is expected to have a negative effect on stock returns through the flow channel by reducing the cash inflows of the firm through increases in the cost of adaptation to and mitigation against climate change. On the other hand, the stock channel relies on portfolio diversification or portfolio balance theory. This channel also suggests a negative relationship between climate change and stock returns, as climate change increases the demand for climate-related investment and reduces the demand for conventional stocks. This will reduce stock prices and eventually, the stock returns of conventional stocks. As lower stock returns suggest that investment is more risky, climate change may be expected to spur higher volatility in conventional stocks.
Despite the rising consciousness of stock exchanges to the need for capital market financing of the huge climate change funding gap (Reichelt, 2010), limited attention has been paid to the effect of climate change on stock returns of conventional stocks.[2] This study fills this important gap in the literature by examining the effect of climate change on stock return volatility of Asian stock markets. Apparently, Asian stock markets are among the top emerging stock markets and have adjusted over time to accommodate climate change-related investment. IFC (2017) reports that climate business activity in key sectors such as renewable energy, green buildings, and energy-efficiency has increased since the Paris Agreement, boosted by governments’ commitment to address climate change. Hence, climate change may be expected to have some impact on Asian stock market returns and volatility.
The conclusions from the existing literature on the effect of climate change on stock market performance are mixed. Two strands of literature can be identified. One strand of the literature, held by Vlady (2015), hypothesizes that although climate change poses significant threat to human existence in the long run, the stock market performance of countries has not been significantly affected by climate change. Vlady (2015) finds that climate change does not significantly impact the leading Australian companies and the whole Australian market. The second strand of the literature posits that climate change can influence stock returns and volatility significantly (see, for example, Antoniuk & Leirvik, 2021; Ramelli et al., 2021). Specifically, Antoniuk and Leirvik (2021) find that events related to climate change policy have significantly impacted returns. Also, Ramelli et al. (2021) reveal that climate change causes decrease in the stock prices of carbon-intensive firms.
This study contributes to the literature on climate change and stock market performance from the empirical and methodological perspectives. Empirically, the study considers the case of Asian stock markets whose resilience, or otherwise, against climate change has not been previously assessed despite the rising awareness about climate change and climate-related investments. From the methodological perspective, the study employs GARCH-MIDAS approach, which is similar but different from AR–GARCH model employed by Vlady (2015). The Generalized Autoregressive Conditional Heteroskedasticity variant of Mixed Data Sampling (GARCH-MIDAS) model, as proposed originally by Engle, Ghysels, and Sohn (2013) is a GARCH variant model that has been empirically validated to be effective in dealing with volatile series such as stock returns. However, its MIDAS augmentation allows us to examine the effect of climate change (indicated by changes in global temperature)–a monthly frequency variable on daily frequency stock returns and volatility data. The effectiveness of GARCH-MIDAS in assessing the effect of monthly frequency variables on stock market performance has been validated in the literature (see Salisu et al., 2022; Salisu & Gupta, 2021; Wang et al., 2020).
The remainder of the study is organized as follows: Section II discusses data issues and stylized facts; methodology is presented in Section III; Section IV presents and discusses the empirical results; and Section V concludes the paper.
II. Data and Stylized facts
To investigate the effect of climate change on Asian stock market performance, relevant data on climate change and stock markets were obtained. The data for share price indexes for the top 10 Asian stock markets[3] were obtained from online at the online data stream (investing.com). These include BSE (India), NSE (India), Shenzhen (China), Shanghai (China), Hong Kong, Singapore, South Korea, Thailand, Tokyo, Japan, and Taiwan. The continuously compounded stock returns for these stock markets were computed by taking logarithm differences of the stock price indices The data for global temperature anomaly[4] used as proxy for climate change was obtained from National Aeronautics and Space Administration (NASA) Goddard Institute for Space Studies (GISS) (see https://data.giss.nasa.gov/gistemp/). The data is available monthly from January 1960 to December 2021, but its use was constrained by availability of stock prices data. To maintain uniform data frequency for all the stock markets, this study has a sample period of nine (9) years: from 04 January 2013 to 31 December 2021.
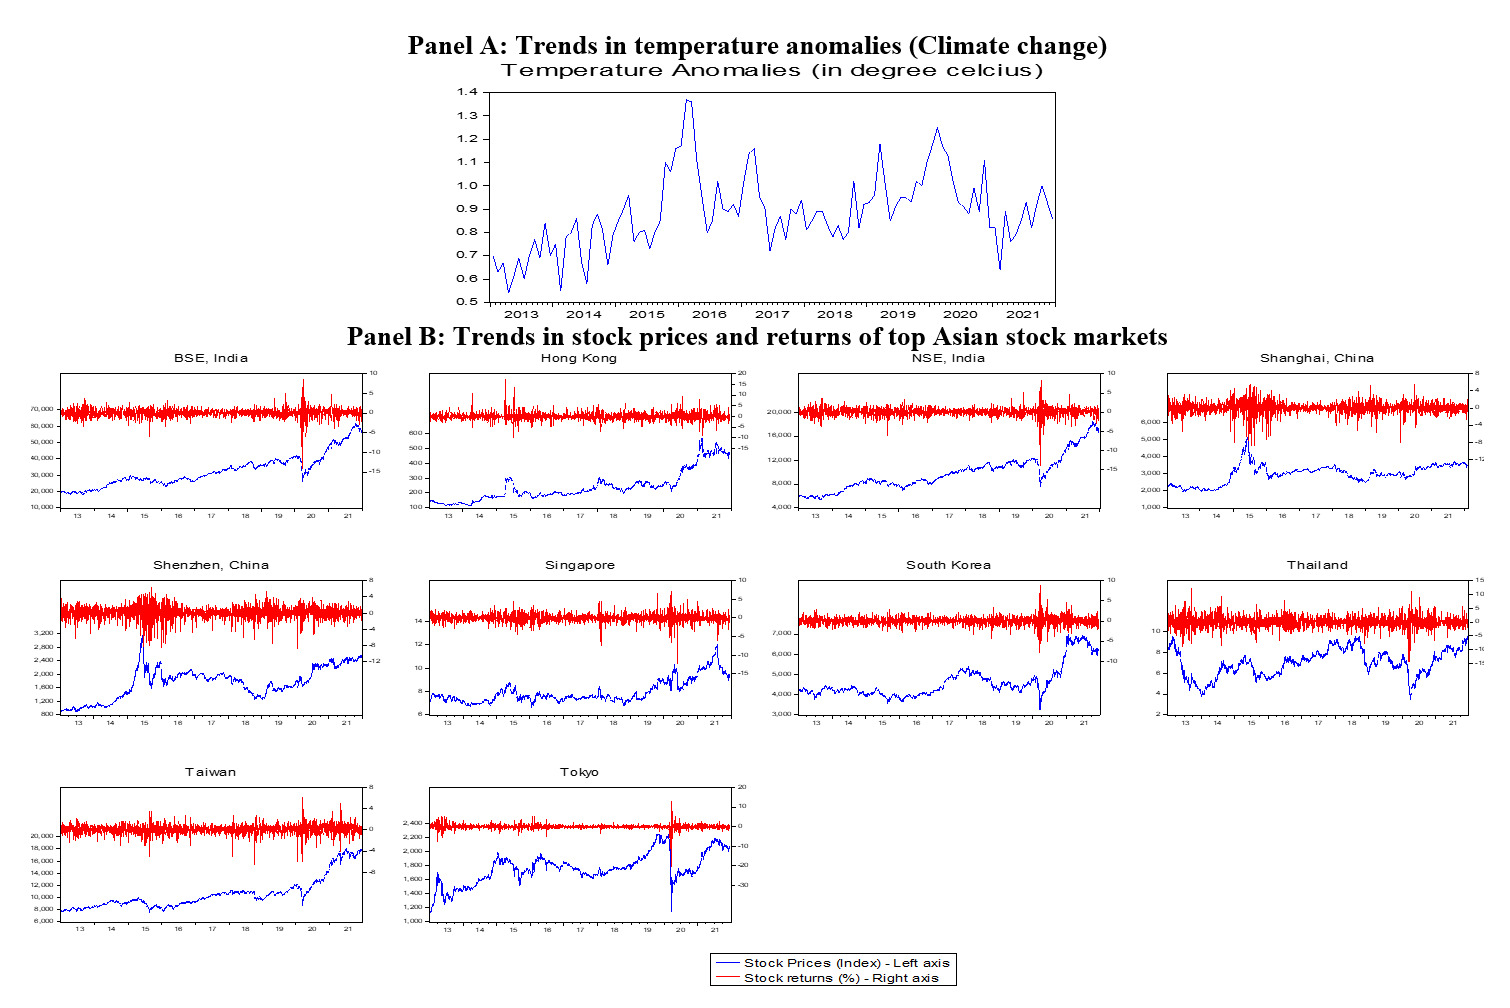
Figure 1 presents the trends in climate change and stock returns of Asian stock markets over the period of study. This is divided into two panels: A and B. In Panel A, which presents the graph for temperature anomalies, it can be observed that temperature anomalies (deviation from normal) increased over time beyond its value in 2013. This observation is supported by the 3-year average summary presented in Table 1. Evidently, the temperature anomalies increased from 0.77oC in the first three years, to 0.93oC and 0.95oC in the second and third three years respectively. This suggests that global temperature has been consistently warmer, which indicates a climate change problem. The trends in the stock market prices and their corresponding returns are presented in Figure 1 (Panel B). The figure shows that Asian stock markets behave in unique ways over the study period. This is to the extent that the two stock markets from China (Shanghai and Shenzhen) had different trend patterns, although this cannot be said of the two stock markets from India (BSE and NSE). Comparing the spikes displayed by the return’s plots, Chinese stock markets appear to generate the highest volatility, particularly during the 2015 stock market crash.
The 3-year averages of Asian stock market returns are also presented in Table 1. The table reveals that stock market returns of each Asian stock market behave in unique way. On the average, however, as climate change problems advanced over the period, the stock returns of Indian (BSE and NSE), South Korean, Thailand, and Taiwanese stock markets increased, while the stock returns of other the markets (Hong Kong, China (Shanghai, Shenzhen), Singapore, and Tokyo declined, particularly between the first and second three years. This gives credence to the argument by Vlady (2015) that the stock returns of countries have not been significantly affected by climate change and may be valid subjects for empirical scrutiny. Nonetheless, we cannot also rule out the possibility of climate change causing reduction in stock returns of some other stock markets. This provides the basis for empirical analysis of the relationship between climate change and Asian stock markets in this study.
III. Methodology
Given that our dependent and independent variables are of different frequencies, this study employs a mixed-frequency consistent technique, the GARCH-MIDAS model by Engle et al. (2013). The daily stock return series are computed as - where represents the price index for day i in month t with and denoting the monthly and daily frequencies, respectively. In other words, is the number of days in a given month t. We construct a GARCH-MIDAS-X model such that climate change is expressed as an exogenous variable. Essentially, there are two components involving the mean and conditional variance equations, while the latter is further divided into short- and long-run components to accommodate the predictor series.
ri,t= μ+ √τt×hi,t ×εi,t, εi,t|Φ i−1,t∼N(0,1), ∀ i=1,…,Nt
hi,t=(1−α−β)+α(ri−1,t−μ)2τt+ βhi−1,t
log(τt)=m+ θK∑k−1 ∅k(w1, w2)Xt−k
where Equation (1) defines the mean equation while Equations (2) and (3) are for the conditional variance components specified, respectively, for short- and long-run components. In terms of the definition of parameters, is the unconditional mean of the return series; is the short-run component of the high frequency (stock returns) variable. This is specified following process, where and are the ARCH and GARCH terms, respectively, conditioned to be positive and/or at least zero and summed up to less than unity The term captures the long-run component, and this incorporates the role of climate change (denoted by X). It involves repeating the monthly value throughout the days in that month. Also, is considered rather than to ensure the positivity of the long-term volatility, and is the beta weighting scheme
∅k(w1,w2)=(k/(K+1))w1−1⋅(1−k/(K+1))w2−1∑Kl=1(l/(K+1))w1−1⋅(1−l/(K+1))w2−1
The weights, are completely determined by two parameters and It is easy to discover that for and Accordingly, a positive (negative) coefficient of X, will imply that climate change increases (reduces) long-term stock return volatility. Since climate change is a systematic risk, the Arbitrage Pricing Theory (APT) suggests that it will increase stock market volatility and reduce stock returns. Thus, our hypothesis that climate change reduces stock returns and increases stock market volatility of Asian stock markets holds if is positive and statistically significant.
IV. Results
Empirical results for this study are presented in Table 2. This consists of the coefficients of ARCH and GARCH ) terms, as well as the coefficient of the effect of the exogenous variable (climate change) on long-term stock return volatility These results show that Asian stock markets exhibit temporary volatility persistence. This is apparent as the sum of ARCH and GARCH terms is less than 1 for all the Asian stock markets. Examining the effect of the exogenous variable (climate change) on long-term stock return volatility the results reveal that climate change has a statistically significant positive effect on the long-term stock return volatility of about 40% of Asian stock markets (BSE, India; Shenzhen, China; Singapore; Thailand), a statistically significant negative effect on the long-term stock return volatility of about 20% of Asian stock markets (Hong Kong; NSE, India), and an insignificant effect on the long-term stock return volatility of about 40% of Asian stock markets (Shanghai, China; South Korea; Taiwan; Tokyo).
The significant positive effect of climate change on long-term stock return volatility suggests that climate change tends to cause higher volatility in about 40% of Asian stock markets. As higher volatility implies that the markets are riskier, it suggests that climate change causes less investment and less stock returns in about 40% of Asian stock markets. This result is consistent with the findings of earlier studies such as Antoniuk and Leirvik (2021) and Ramelli et al. (2021) which concluded that climate change has significant influence on stock returns and volatility. This conclusion can also be extended to about 20% of Asian stock markets where climate change was found to exhibit a significant negative effect on their stock return volatility. In other words, climate change causes stock return volatility of these markets to reduce. Thus, with lower associated risk, investment demand and stock returns of these markets are expected to increase despite increases in the incidence of climate change. This suggests that the possibility of investors diversifying from climate-oriented investment to conventional stocks cannot be ignored.
Lastly, the results show that about 40% of Asian stock markets are resilient to climate change, as their stock return volatility, and by implication their stock returns, does not respond significantly to climate change. This result is consistent with Vlady (2015) who argues that the stock returns of countries have not been significantly affected by climate change.
V. Conclusion
Despite the rising consciousness of stock exchange to the capital market financing of the huge climate change funding gap, limited attention has been paid to the effect of climate change on stock returns of conventional stocks. This study fills this important gap in the literature by examining the effect of climate change on stock returns of Asian stock markets, which are among the top emerging stock markets and have adjusted over time to accommodate climate change-related investment. The study employs the GARCH-MIDAS model as proposed originally by Engle, Ghysels, and Sohn (2013). This was augmented by the exogenous variable, namely climate change, which is described as global temperature anomalies. The results show that climate change has a statistically significant positive effect on the long-term stock return volatility of about 40% of Asian stock markets (BSE, India; Shenzhen, China; Singapore; Thailand), a statistically significant negative effect on the long-term stock return volatility of about 20% of Asian stock markets (Hong Kong; NSE, India), and an insignificant effect on the long-term stock return volatility of about 40% of Asian stock markets (Shanghai, China; South Korea; Taiwan; Tokyo).
Overall, the results reveal that the effect of climate change on Asian stock market is mixed. Climate change tends to reduce stock returns in about 40% of the markets, increase stock returns in about 20% of the market and does not have significant impact on about 40% of markets. The result implies that more investors diversify from conventional stocks to climate-oriented stocks than vice versa, while some investors do not make any investment change with regard to climate change. More so, we can infer that about 40% of investments in Asian stock markets are insensitive to climate change financing. Thus, more awareness and orientation about investment in climate-oriented stocks is recommended across Asian stock markets. As this is a short paper, the role of other potential systematic risk indicators such as oil price and macroeconomic factors (see Salisu et al., 2019) is not emphasized. Future research may reconsider this discussion by accounting for the role of potential systematic risks factors peculiar to Asian economies.
Salisu and Oloko (2015) define the relationship between exchange rate and stock returns using stock and flow models. The relationship between climate change and stock returns is described in this study following the same line of thought. This is justified as climate change affects cash flow and provides alternative investment options (environmental-related investment, like exchange rate) to investors.
Majority of the existing studies are on climate-related stocks (see, for example, Antoniuk & Leirvik, 2021; Ramelli et al., 2021).
The top 10 Asian stock markets were selected based on market capitalization (see https://en.wikipedia.org/wiki/List_of_Asian_stock_exchanges) Accessed: April 8, 2022.
According to NASA, temperature anomalies indicate how much warmer or colder it is than normal for a particular place and time. For the GISS analysis, normal always means the average over the 30-year period 1951-1980 for that place and time of year.