I. Introduction
The world is currently facing a health crisis, which has altogether become a financial crisis. In March 2020, the World Health Organization (WHO) defined this fast-paced virus outbreak as a pandemic (AlAli, 2020; Gherghina et al., 2020). The confirmed cases of COVID-19 are reported as 395 million with more than 5.74 million death cases (Google, 2022). The pandemic has proved to have dire consequences, with much unexpected negative impact towards economic activities in addition to the causalities (Yilmazkuday, 2020). Given the rapid spread of COVID-19 with emergence of various variants and mutants, the worldwide economic and financial systems indicators show volatile positions, especially for stock markets, foreign exchange rate, and interest rate (Kartal et al., 2020).
To measure the severity of the financial impact due to the pandemic, the Google Mobility Index (GMI) was used as a proxy to study the mobility effect and the analysis restricted to stock markets’ performance. This restriction was to reflect that less mobility by people, transportation, travelling, and businesses will result in various implications, particularly on business performance. As business revenue shrinks due to less demand and more supply, this shrinkage of revenue will subsequently cause share prices to drop and thereby influence stock indexes. The continued drop in mobility would result in investment withdrawal by investors which will severely impact the economy and financial performance of the country.
The recent literature on GMI and COVID-19 clearly evidence the fact that financial and economic movement are highly volatile and significantly subject to the mobility of an individual. This demands a better policy decision by considering the mobility factor of an individual during the pandemic (Kydland & Martínez-García, 2020).
In this paper, the ASEAN markets were used for these analyses as there are many studies dealing with developed markets, with less concentration on emerging economies like the ASEAN. Thus, the intention is to zoom in on how mobility affects the ASEAN stock markets, thus bringing the issue of COVID-19 and stock market performance into perspective. This paper thus duly claims two main contributions. First, I believe this is a pioneering paper dealing with ASEAN markets as the present literature mainly focuses on the developed and developing countries. The focus of this paper is mobility and its impact on the stock markets which has implications for investors as well as policymakers regarding the management of COVID-19. From a methodological perspective, this paper combines time-series and wavelet transform which have significant reference to investigation involving different time horizons.
The rest of the paper is organized as follows. Section II illustrates methodology. Section III discusses results and Section IV concludes the paper.
II. Data and Methodology
As stated, GMI was employed in this research to measure the mobility index.[1] The use of GMI shows a rapid increase in the recent literature investigating the issue of COVID-19 (Nouvellet et al., 2021). Returns for the stock indexes were calculated using the following formula: where is represent return of the individual stock index and later for the equation section, this variable proxied as a MI, is represent the current index value in natural log form while is known as the index value for the day before in natural log form. The time-series analysis was utilized using the vector error correction model (VECM), followed by time-frequency domain analysis. The VECM model is presented as follows:
ΔMIi=μ1t−θ1(ΔMI−γ0−γ1GMIi)t−1+j∑i=1β1,jMI1t−i+j∑i=1β2,jGMI1t−i +ε1t.
The variable MI is representing the market index of the individual series.
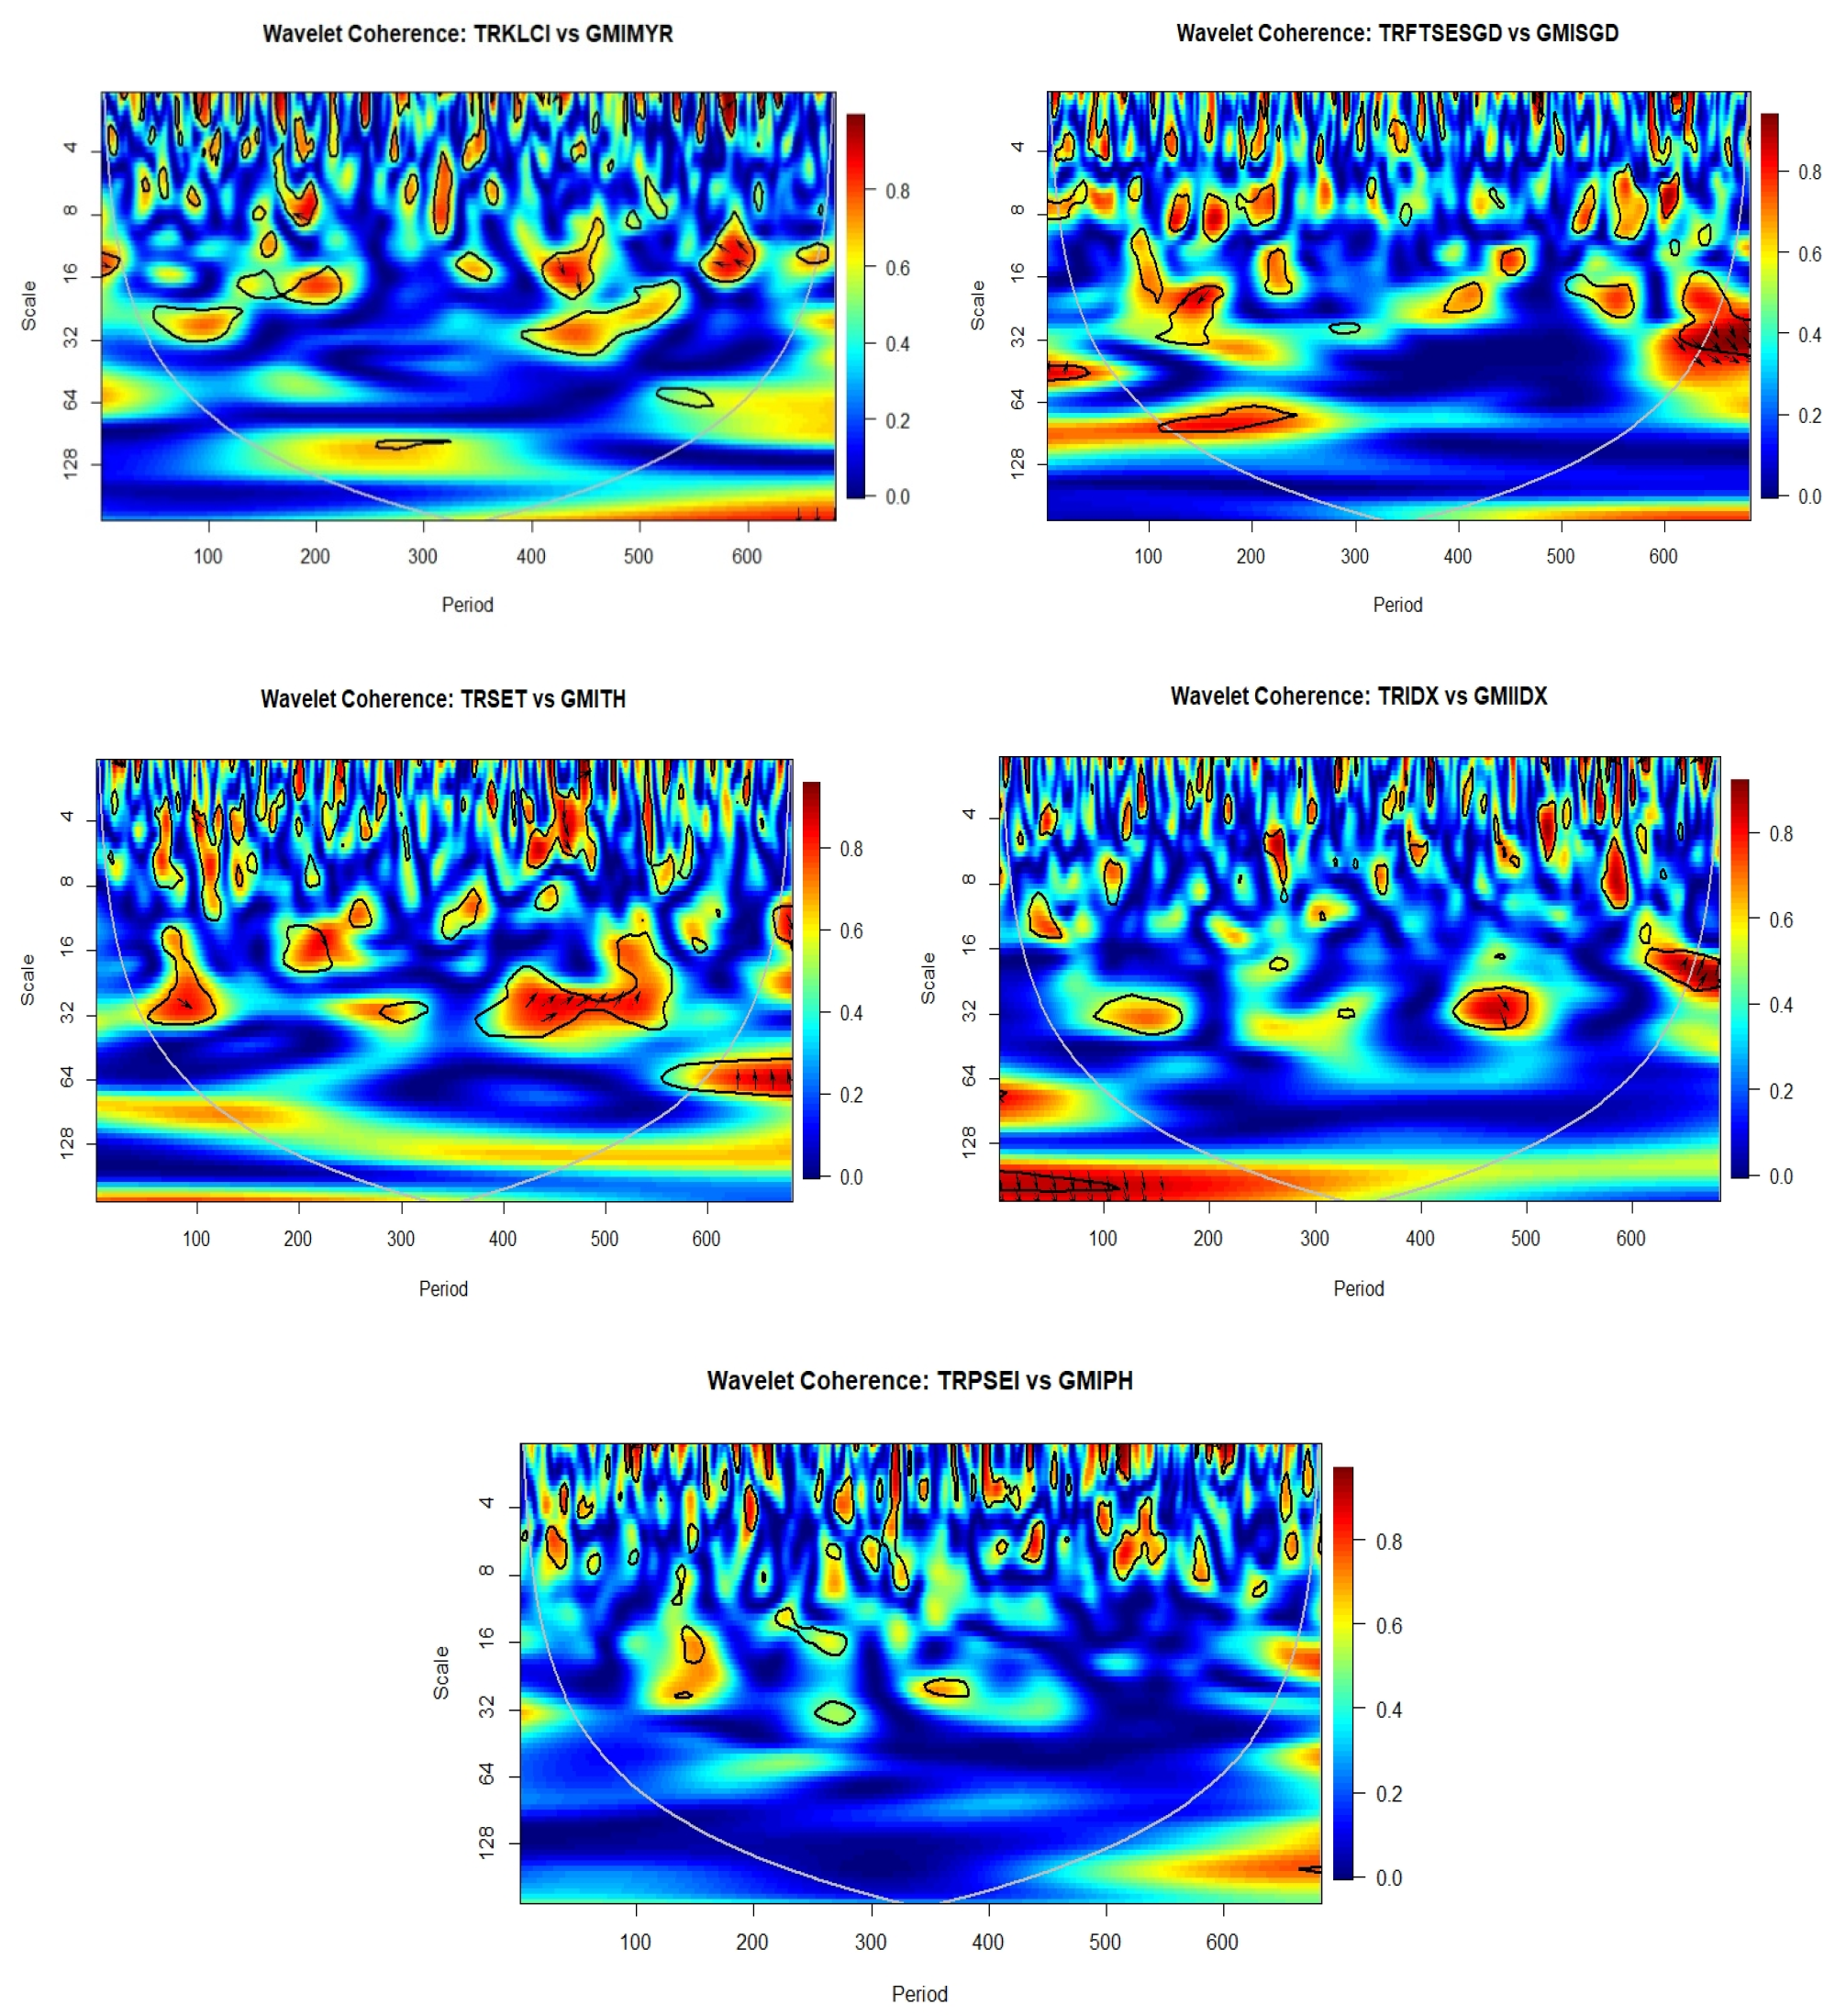
Next, the time-frequency domain analysis based on Coherence Wavelet Analysis (CWA) transformation signal is the cross-wavelet spectrum of GMI and market returns of the individual series is defined as The is called as time horizon while is known as scale and the power spectrum was generated using the R-Studio. The following abbreviations are defined as follows. GMIMYR is Malaysia google mobility index, GMISGD is Singapore google mobility index, GMITH is Thailand google mobility index, GMIIDX denotes Indonesia google mobility index, GMIPH is Philippines google mobility index, TRKLCI represent Malaysia stock index, TRFTSESGD is Singapore stock index, TRSET is Thailand stock index, TRIDX denotes Indonesia stock index and TRPSEI represents Philippines stock index.
III. Empirical Results
A. Time Series ECM-Based Causality Experiment and Regression Analysis
Table 1 shows the long-run association between stock markets and mobility indexes. The values of the coefficients are significant at 5 percent for all five ASEAN markets. Four markets revealed a negative sign with GMI (Malaysia, Thailand, Indonesia and the Philippines) while Singapore has a positive relationship with GMI. To illustrate, if the GMI for Malaysia increases by one percent, it will disrupt the performance of Malaysia’s stock market. Significant high decreases occur in the Philippines market, followed by the Thailand, Malaysian, and Indonesian stock markets. The findings by Sifat and Thaker (2020) and the argument by Tantaopas et al. (2016) provide some indication on this phenomenon of Singapore’s positive association. Investors’ attention and stock market direction are strong when it comes to small, well-established, and productive countries like Singapore. The country is thus able to perform better given the idiosyncratic and good economic factors (i.e., driven by local economy production). Looking into the error correction term (ECT) to capture the speed of adjustment in the long-run, all selected ASEAN countries recorded negative association. For instance, the market index with GMI is -0.92 for the Philippines, meaning that 92 percent of that disequilibrium was anticipated for the next period and 8 percent remained. The higher percentage revealed that GMI impacted the stock markets quite tremendously and only a small percentage remained, thus an unexplanatory variable. The results for ECT for selected ASEAN countries were more than 80 percent. To measure the individual relationship between the stock market and GMI, a single ordinary least square (OLS) test was performed. The results show that three markets have a positive association with GMI: Malaysia (0.3037), Indonesia (0.0620), and the Philippines (0.6689). The other two markets, conversely, have an indirect relationship: Singapore (-1.0033) and Thailand (-0.8722). The results are significant and yielding that GMI plays an important role in explaining the behavior of the financial markets especially during the period of the pandemic, together with other direct and indirect factors. In capturing short-run association, I carried out the Granger Causality Test and found that only two markets had an association with GMI: Thailand and the Philippines. Typically, the impact of crisis, including any health crisis, will result in long-term impact and in the short-term, the impact would not be apparent (see Table 2).
B. Time Frequency Domain Analysis - Coherence Wavelet Analysis
I used CWA to measure the association of GMI to the ASEAN-5 markets in capturing their association in different time domains. My findings revealed that, for the short-run (i.e., 1-16 days), three markets offer mixed results with a moderate relationship with GMI (Malaysia, Singapore, and the Philippines), while a strong relationship can be observed for Thailand only. Meanwhile, lead-lag association occurred only for Malaysia and Thailand. In the medium-run, three markets encountered a weak relationship with blue dominancy (Malaysia, Indonesia, and the Philippines). Three markets showed a lead-lag relationship (in-phase) between stock markets and GMI. For the long-run, most of the markets offer a no-phase relationship as vaccination efforts took place aggressively worldwide including in the ASEAN region and the slow economic recovery. Three markets (Malaysia, Thailand, and Indonesia) show a strong association due to the emergence of different COVID-19 variants throughout the period, which impacted the financial markets and policy implementations. The conclusion and summary of findings for CWA are presented below.
.png)
IV. Conclusion
Overall, COVID-19 has had a significant impact on the ASEAN-5 stock markets and this was influenced by the mobility factor. This paper has thrown light on the significant relationship between ASEAN-5 markets and mobility, as the impacts are impactful and momentous in the long run instead of the short run. Furthermore, this paper has found that there is a strong co-movement between mobility and stock markets performance in the long run for ASEAN-5 due to the different variants of COVID-19 and the progressive implementation of vaccinations around the globe. It is observed that mobility plays an important role as one of the drivers for the financial market, which reflects investors’ confidence and country-specific performance. Through the advanced methodology this paper employs, attention is drawn to the mobility factor by providing a novel discussion from different time horizons to capture the association between the variable and stock markets, particularly for the ASEAN-5 during the COVID-19 pandemic as intimated in the corresponding tables and figures.
Data for the GMI is freely available and accessible at the following link: https://www.google.com/covid19/mobility/ and details for the stock markets were extracted from https://www.investing.com/ and https://www.wsj.com/.