I. Introduction
In this paper, we examine the role of Bitcoin as a good hedge against uncertainty during the COVID-19 pandemic. The study’s motivation has roots in the growing interest towards cryptocurrencies, which suggests diversification properties of Bitcoin during the COVID-19 pandemic (see, for example, Huang et al., 2021; Ozdemir & Ozdemir, 2021; Widarto et al., 2022). Yet, the increased volatilities of financial assets including cryptocurrencies during the pandemic suggests otherwise (Chen et al., 2020; Choi & Shin, 2022; Conlon & McGee, 2020; Grobys, 2021).
The recent ‘crash’ in the Bitcoin (or cryptocurrency) market shows vulnerability of the market and raises questions regarding whether the cryptocurrency market can be a diversification tool for portfolio managers. Unlike the conventional and Islamic stock markets, the cryptocurrency market is new, being introduced only in the year of 2010 (Williams, 2022). Nonetheless, conventional investors are increasingly aware of the potential benefits of including cryptocurrencies, such as Bitcoin, in their portfolios, and studies also reveal the benefits of diversifying investors’ portfolios by investing into cryptocurrencies (Letho et al., 2022; Weinmayer et al., 2019). Modern day investors’ interest in cryptocurrencies is not without reasons, as news on the value of Bitcoin and other cryptocurrencies is continuously reaching an all-time high during the COVID-19 pandemic.
There is evidence of Islamic stock market’s resilience during the global financial crisis (Masih et al., 2018) and the recent pandemic (Arif et al., 2021). It is not surprising that a global crisis like the COVID-19 pandemic would adversely affect stock markets (see, for example, Al-Awadhi et al., 2020; He et al., 2020; Phan & Narayan, 2020), but such an impact on Islamic stocks is less severe (Salisu & Shaik, 2022). There are however limited empirical studies on the effect of the COVID-19 pandemic on Islamic stock markets. Further, the literature considering cryptocurrency as a method of portfolio diversification for Islamic equity investors is especially scarce possibly due to uncertain validity from Shariah perspective. Lacking options, Shariah compliant investors who are in search for international diversification avenues during this period may find that even stock markets in Asia, the fastest growing economic region, are badly affected by the pandemic (see, for example, Rabhi, 2020). Salisu & Sikiru (2020), however, examine Asia-Pacific Islamic stocks and find hedging properties even during the pandemic crisis.
Inspired by these studies, we hypothesize that Bitcoin is likely to serve as a good hedge for Asian Islamic stock market investors during the COVID-19 pandemic. Thus, we explore the link between Bitcoin and Islamic stocks in Asia by using the most recent datasets available. While our interest is on the Asian Islamic stock market and Bitcoin, our empirical analysis will dissect the Asian market into five individual developed-country indices and one index for emerging markets in Asia. The study’s findings have implications for portfolio diversification strategies, particularly for investors seeking to minimise risk through Bitcoin.
Using a time-varying volatility model suitable for the variables of interest (see Rudolf et al., 2021), we find evidence in support of the hedging potential of Bitcoin for the Asian Islamic stocks during the COVID-19 pandemic. The results supporting this conclusion complement the growing importance of the Asian economy and Islamic financial markets. These findings make three contributions to the literature. First, it extends the literature to assess the volatility of Bitcoin and the Asian Islamic stock markets during the pandemic. The second contribution relates to the assessment of the hedging potential of Bitcoin (the largest cryptocurrency by market capitalisation) for Asian Islamic stocks during the COVID-19 pandemic era. Following our study, future studies can test the hedging potential of other markets or include a different cryptocurrency for the COVID-19 period. Finally, we test whether the hedging properties of Bitcoin differ across developed and emerging Islamic stock markets in Asia during the start of the pandemic until the endemic phase. The rest of the paper is organised as follows. Section II discusses the data and methodology, Section III presents the main findings, and Section IV provides the conclusion.
II. Data and Methodology
Our data covers daily time series closing prices from March 13, 2020, to May 31, 2022, which we collect from Thomson-Reuters DataStream and Yahoo Finance. As the proxies for Islamic stock returns, the MSCI Islamic index returns dataset consists of the closing daily prices of five developed stock markets in the Asia-Pacific region (Australia, Hong Kong, Japan, New Zealand, Singapore) and one MSCI Emerging Asian Islamic Market alongside Bitcoin prices. The MSCI index is used, as Majdoub and Mansour (2014) noted, because it has a stringent guideline for stocks to be included.
The study implements the multivariate GARCH DCC (MGARCH-DCC) proposed by Pesaran and Pesaran (2007) to study the time-varying volatilities and correlations of stock indices with Bitcoin. This method allows observation and analysis of the precise timings of shift in conditional correlations and volatilities, replacing the traditional approach of using historical covariance mix via a two-stage estimation. In first stage, conditional variances of each asset is estimated by means of the following univariate GARCH (X,Y) model:
hit=ωi+ Xi∑x=1αixr2it−x +Yi∑y=1βiyhit−y ,for i=1,2,...,k
whereby and are non-negative and The parameter denotes shocks to return X due to a short-run persistence (ARCH effects), is the contribution of shocks to return Y due to a long-run persistence (GARCH effects) and k represents the number of assets.
As for the second stage, the time-varying conditional correlation between index returns will be calculated by using the general equation of the DCC estimator as follows:
Ht=DtRtDt
whereby denotes multivariate conditional covariance matrix, represents a k x k matrix of conditional time-varying standardized residuals which will be generated from the univariate GARCH model at the first step as follows:
Dt=diag (√h11,t, √h22,t, …, √hkk,t
It is a symmetric positive definitive matrix having on its diagonals, I = 1, 2, . . ., k.
The matrix is the time-varying correlation matrix (off-diagonal elements).
Rt=Q∗−1t QtQ∗−1t
where = is derived from
Qt=(1− ∅− γ)¯Q+ γQt−1+ ∅σi,t−1σj,t−1
the k x k symmetric positive definitive matrix, where is a k x k symmetric positive definitive conditional (time-varying) covariance matrix of standardized residual:
σit= εit√hit
and is the unconditional correlations of are non-negative scalar parameters satisfying < 1. The matrix is the diagonal matrix consisting of the square root of the diagonal elements of
Q∗t=diag (√q11, √q22 …, √qkk)
Thus, the conditional correlation of X and Y stock indices at time t can be calculated as
follows:
ρij, t =[(1−∅−γ)¯qij+∅σi,t−1σj,t−1+γqij,t−1]÷{[(1−∅−γ)¯qii+∅σ2i,t−1+γqii,t−1]1/2 ⋅[(1−∅−γ)¯qjj+∅σ2j,t−1 +γqjj,t−1]1/2}
where is the element on the ith line and jth columns on the matrix (Bollerslev, 1988). Through Bollerslev’s (1988) model, the conditional log-likelihood of the parameters based on the Gaussian assumption can be summarized as:
L= −12 T∑t=1[(klog(2π)+ log|Dt|2+ ε′tD−1tD−1tεt)+(log|Rt|+ σ′tR−1tσt−σ′tσt)]
where k denotes the number of equations and T denotes the number of observations.
In stage one, only the volatility component is maximized, i.e., the log-likelihood is reduced to the sum of the log-likelihood of the univariate GARCH model. Later, in stage two, the correlation component is maximized (conditional on the estimated with the standardized residuals obtained from stage one. Utilising the Gaussian assumption in holding for daily returns is a controversial issue, as it results in an underestimation of portfolio risk. In fact, despite consistency under the two-stage estimation of the likelihood approach (Engle & Sheppard, 2001), it could likely be inefficient under Gaussianity (Pesaran & Pesaran, 2010).
In a nutshell, the DCC modelling allow identification of changes (when and how it occurs) in the interdependence between variables of a time series. Therefore, it allows identification of possible diversification benefits provided by Bitcoin in a dynamic environment such as during the global COVID-19 pandemic. The MGARCH-DCC model is known to be a reliable estimator of portfolio estimators and has been used by Fantazzini (2009), Chevallier (2012), and Aas and Berg (2013) to investigate Value at Risk, time-varying correlations, and multivariate dependence structures.
III. Main Findings
The maximized log-likelihood value obtained by the t-DCC model (11,674.2) is higher than that obtained by the Gaussian model (11,590.1). Besides, the estimated degree of freedom for the t-normal distribution is 7.0051, which is below 30. Therefore, this result implies that the fat-tailed nature of Islamic index returns, and Bitcoin tends to be best captured by the t-distribution model. As t-DCC model is the most suitable model for the study of Islamic indices and Bitcoin, based on Table 1. The volatility parameters observed under t-DCC model are highly significant, with the estimates of i = 1, 2, 3, 4, 5, 6, 7 being close to one, implying a slow volatility decay. Furthermore, the sum of lambda1 and lambda2 for all Islamic stock indices and Bitcoin (e.g., lambda1_AUS + lambda2_AUS = 0.9786) is equal to or less than 1. This indicates that after a shock in the market, the riskiness associated with the returns may slowly disappear, meaning that the shock to the return volatilities is only temporary.
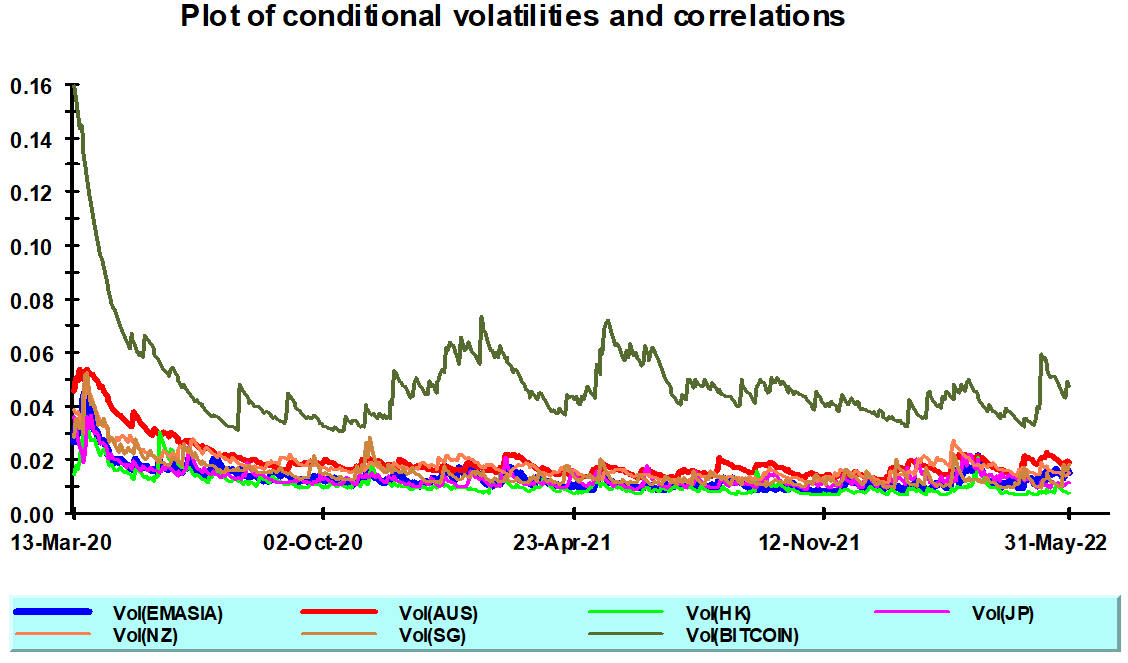
The dynamic conditional volatilities for each Islamic stock index and Bitcoin return are shown in Figure 1. According to these estimates, the conditional volatilities of the stock indices follow nearly the same path, except for Bitcoin. The lowest conditional volatility is recorded by the MSCI HK Islamic stock index returns, whereas the highest volatility is recorded by Bitcoin. Both findings are consistent with the findings on unconditional volatilities in Table 2. Within the time interval of the study, the conditional volatility started at its highest-level right after the declaration of COVID-19 as a pandemic by the World Health Organisation (WHO) on 11th March 2020. Not surprisingly, the announcement caused the volatility to remain higher than the rest of the time interval. In studies, such as by Kılıç et al. (2022), which show convergence of volatility among all Islamic stock index returns during the pandemic period, Bitcoin did not show a consistent volatility correlation with the stock indices. Thus, it may be advantageous for investors and portfolio managers to consider Bitcoin as a tool to improve their portfolio diversification strategies because it is weakly correlated with the stock markets. At the end of 2020, there was a slight increase in the convergence of volatility among stock indices with Bitcoin.

Towards the end of 2021, Bitcoin return volatility remained higher than that of Islamic index returns but their correlation during this period is lowest. It was also in the same year that Bitcoin price reached a historical all-time high exceeding USD60,000. The Asian equity markets’ volatility stabilised by the end of 2021, as a response to increased vaccination rates, removal of lockdowns, reduced number of COVID-19 related deaths, and better awareness of virus spread prevention measures. On the other hand, Bitcoin and other cryptocurrencies have stirred up controversies prompting several countries including China to ban all cryptocurrency transactions. Bitcoin prices then crashed and fell by 60% in May 2022 from its all-time high.
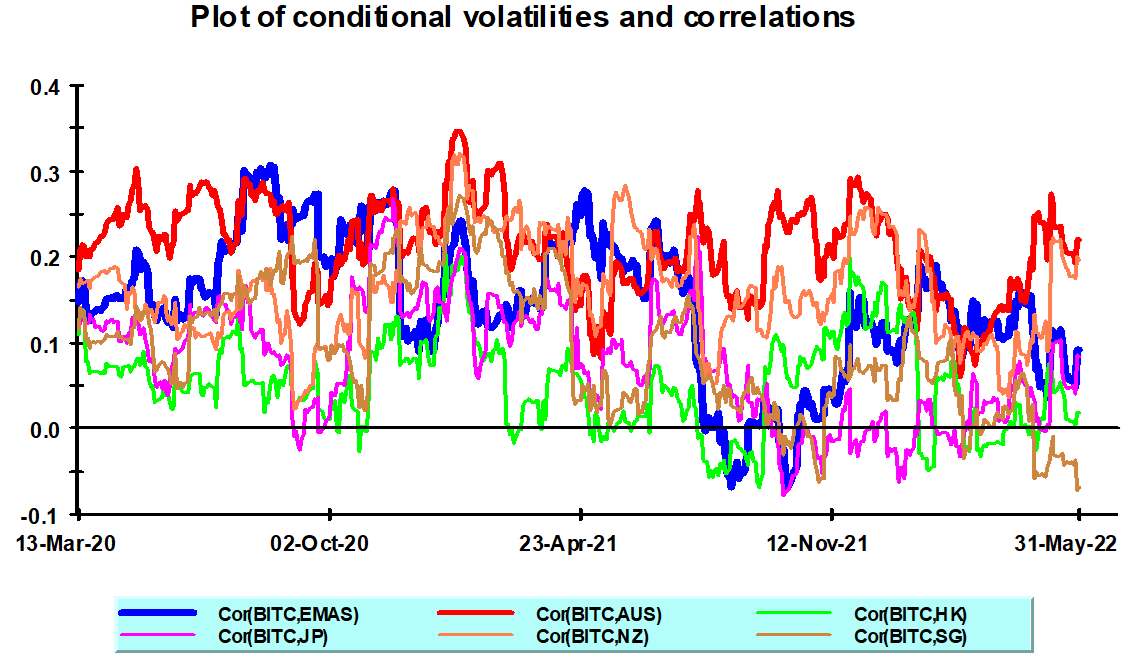
The conditional correlation of Bitcoin returns with Asia’s Islamic index returns are shown in Figure 2. The plot indicates that the return correlations of Bitcoin with Asian Islamic indices, except Australia, seem to move toward zero at some point during the pandemic, especially towards the end of 2021 and the first half of 2022. Moreover, the graph confirms the results of the unconditional correlations in Table 2, showing that Bitcoin returns are highly correlated with Australia’s stock returns as compared to the other stock returns. The Islamic market returns seem to have generally low correlation with Bitcoin returns at least for investors in the Asian region. Thus, it can be suggested that if the Asian-based Islamic equity investors were to invest their assets, they should include Bitcoin in their portfolios in order to take advantage of its diversification benefits.

IV. Conclusion
This research aims to help Islamic equity investors identify potential portfolio diversification benefits by examining DCCs between Bitcoin returns and the returns of developed stock markets of the Asian region and Asian emerging markets. The study is undertaken from two perspectives: Islamic equity investors in developed Asian countries and Islamic equity investors in emerging countries within Asia. The multivariate GARCH-DCC is used to evaluate the time-varying links between Bitcoin and Islamic stock index returns during the COVID-19 pandemic. The analysis discovers that there is a significant increase in conditional volatilities of Islamic stocks index and Bitcoin returns after the WHO declared COVID-19 a pandemic in March 2020. The conditional correlations of Islamic stock index and Bitcoin remained weak, indicating possible diversification benefits. Although being the most volatile, Bitcoin has a low correlation with the MSCI Islamic stock indices. Future research may undertake a comparative analysis of the DCCs among Bitcoin, Islamic, and conventional stocks.
Acknowledgement
I would like to thank the Editor and an anonymous referee for many helpful comments. However, the usual disclaimer applies.