
Introduction
This paper examines the possible impacts of the COVID-19 pandemic on cryptocurrencies. The cryptocurrency market occupies a significant portion of the contemporary financial world. Its market size has been increasing due to the easy public adoption of digital currencies and advanced technologies. Many scholars anticipate that cryptocurrencies will become a future financial tool in the global markets, along with regular equities, debt securities, foreign exchange instruments, commodities, and precious metals (Soylu et al., 2020). The COVID-19 outbreak has impacted the global financial and commodities markets, and the cryptocurrency market cannot be an exception to this. It has severely disturbed the normal functioning of the world economies. This kind of negative shock creates volatility in the financial market and influences investment and trading behavior. It may also lead to different financial instruments moving in a similar direction or strengthening their mutual association. From the perspective of investment and trading, this develops a research problem pertaining to how the COVID-19 epidemic influenced the efficiency of the cryptocurrency market. This paper tries to address this issue by evaluating the possible impacts of COVID-19 on the cryptocurrency market. It examines the volatility and correlation of different cryptocurrencies in the same market. Some studies investigate the effects of COVID-19 on cryptocurrencies. Yarovaya et al. (2021) analyze the herding behavior in the cryptocurrency market during COVID-19 by using various quantitative techniques and the hourly price movements of five cryptocurrencies. They find that COVID-19 does not lead to herding in the bitcoin market. Demir et al. (2020) study the relationship between different cryptocurrencies with deaths/cases during the COVID-19 pandemic and find that there is a negative correlation between the number of COVID-19 cases and deaths with Bitcoin; however, the correlation for Ethereum and Ripple with COVID-19 cases was weaker, although the similar trend is observed. Examining any complex features in the cryptocurrency market before and during the COVID-19 pandemic is the goal of the current research. Additionally, the paper tries to examine whether the value of one cryptocurrency influences the value of other cryptocurrencies.
Although there are studies on the impact of COVID-19 on the financial markets, still the area has not been fully explored due to its recentness and the ambiguity of the time horizon of the COVID-19 pandemic. The present study aims to add to the existing literature by studying the linkages among the major cryptocurrencies pre-COVID and during COVID. This study also considers the most recent data in this field and incorporates multiple major cryptocurrencies. We investigate the effects of COVID-19 on the cryptocurrency market using the DCC-GARCH models. We use a mutual information approach and a correlation method to understand the cryptocurrency market behavior and to compare the daily returns of five digital currencies from January 1, 2018, to June 30, 2022. The five currencies, Bitcoin, Ethereum, BitCash, Cardano, and Tron, are selected based on their trading volume. They constitute around 90 percent of the cryptocurrency market volume, if we exclude Tether, which is not comparable to these in terms of volume. Our study considers January 1, 2018, to December 31, 2019 as pre-COVID-19 and the subsequent period as the COVID-19 period. From the analysis, we find persistent volatility in the cryptocurrency market both pre-COVID-19 and during COVID-19. The volatility is more prevalent during COVID-19. This observation is for a majority of the cryptocurrencies. Further, the correlation values from the DCC-GARCH model indicate linkages among the cryptocurrencies’ returns, meaning that these cryptocurrencies influence one another.
The rest of the paper is structured as follows. Section II contains the data and methodology. Section III discusses the empirical results. Finally, Section IV concludes the analysis.
II. Data and Methodology
The dataset covers the daily prices of five major cryptocurrencies (Bitcoin, Ethereum, BitCash, Cardano, and Tron). The sample data are collected from the cryptocurrency database (www.coinmarketcap.com" www.coinmarketcap.com). The cryptocurrencies’ prices are expressed in US$, and the daily log returns are manually calculated using the closing prices. The data span from January 1, 2018, to June 30, 2022, with 1642 daily observations. The entire period is divided into pre-COVID-19 from January 1, 2018, to December 31, 2019, with 730 observations, and the COVID-19 period from January 1, 2020, to June 30, 2022, with 912 observations. These two periods help to examine the impacts of COVID-19 on the cryptocurrency returns before and during COVID-19. To understand the COVID-19 period, we consider the daily number of new cases in COVID-19 as the severity of the pandemic. We noticed the new cases are still significant at the present time (i.e., till June 30, 2022). The data on daily additions in the active cases of COVID-19 worldwide is collected from the website of the World Health Organization. Hence, we consider data till June 30, 2022, as the COVID-19 period. As per the available trading volume data, these five cryptocurrencies are active and constitute the largest portion of the market. Table 1 reports the descriptive statistics of all the five sampled cryptocurrencies.
The descriptive statistics show that the cryptocurrencies are highly volatile during the entire study period, as evidenced by the maximum and minimum values. The standard deviation values also show high volatility across the variables. All the variables are positively skewed. The skewness values of the variables indicate that the variables are positively skewed, which means there are many values that are smaller than their average value. The kurtosis values are not equal to 3, showing that the variables do not follow the standard normal distribution. The Jarque-Bera test also confirms the presence of non-normality in the data as the null hypothesis, which assumes that the data is normal, is rejected.
The daily returns of a cryptocurrency are defined as:
Rt=log(PtPt−1)
where Rt is the cryptocurrency return at date t, Pt is the cryptocurrency price at date t, and Pt-1 is the price at date t-1. Following earlier research (Bouri et al., 2017; Corbet et al., 2020), we implement the DCC-GARCH approach (Engle, 2002) to investigate the dynamic correlation of cryptocurrencies. The empirical model is beneficial since it allows for the preservation of conditional volatilities.
The multivariate DCC-GARCH model can be represented as follows:
rt=μt+εt
with where is the vector of the returns, is a vector of zero mean return innovations conditional on the information available at time We employ the dynamic conditional correlation-GARCH (DCC-GARCH) technique to quantify the volatility and correlation of cryptocurrencies. The DCC-GARCH has an advantage over other methods as it does not suffer from dimension hindrance and could be applied to any dimension. It can estimate time-varying volatilities, covariances, and correlations across assets efficiently.
III. Empirical Evidence
The multivariate DCC-GARCH model is used to investigate the volatility of the five cryptocurrency return series. Table 2 summarises the findings. The results show that the returns of all five cryptocurrencies are strongly correlated and exhibit GARCH effects. The constant conditional mean and variance are not significant at 1%, indicating that there is no role of constants in the mean and variance equation, respectively. The ARCH and GARCH coefficients indicate that the cryptocurrencies are highly volatile in both the pre-COVID-19 and COVID-19 periods. The sum of alpha and beta values is near 1 suggesting high volatility. The same is observed for most of the cryptocurrencies in our study. The last panel of the table shows the dynamic correlation coefficient between the cryptocurrencies. This coefficient shows that there is a significant correlation between cryptocurrencies.
In this DCC-GARCH process, we notice from the beta (β) values, which are a measure of persistence in volatility, that volatility is more prevalent among all the cryptocurrencies, except Cardano, during COVID-19 as compared to the pre-COVID-19 period. This finding is similar to the findings of existing studies (Montasser et al., 2022; Salisu & Ogbonna, 2021). Similar results are also noticed for oil price volatility (Devpura & Narayan, 2020). Further, we present the cryptocurrency return series and the new COVID-19 cases in Figure 1.
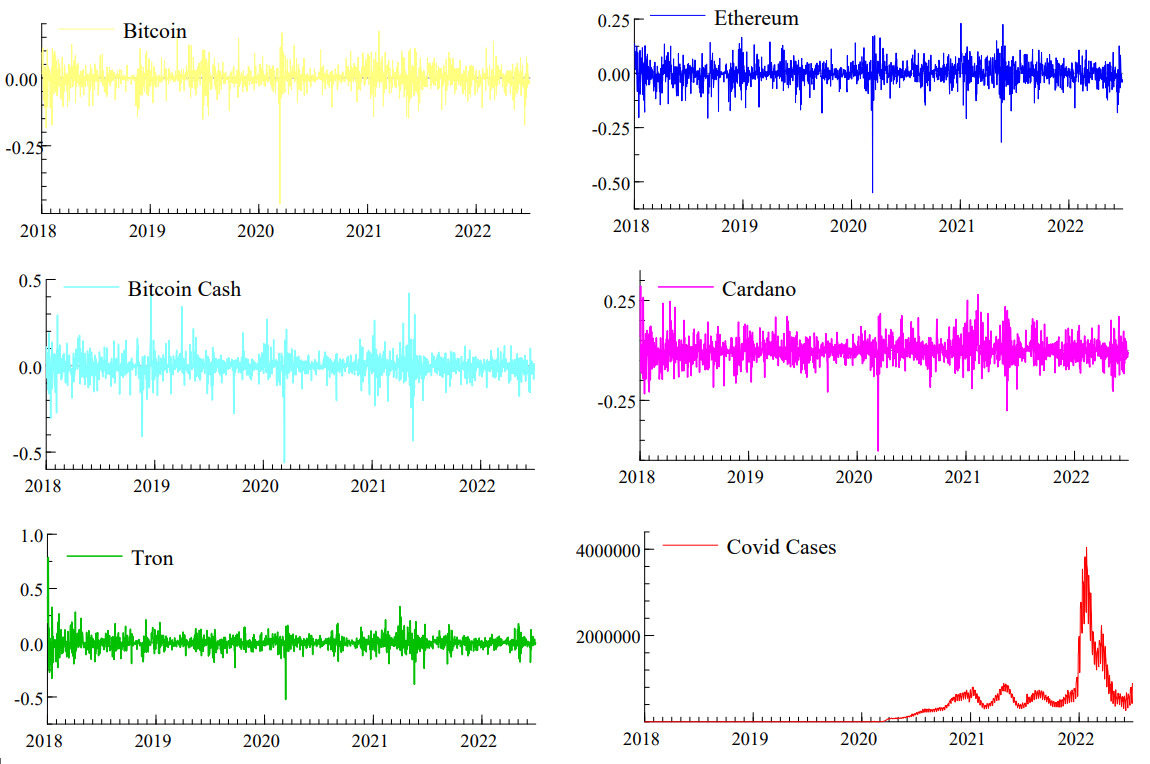
Figure 1 shows that after March 1, 2020, there was a sudden drop in all cryptocurrency returns. Also, at that time, COVID-19 cases started to increase rapidly. In the example, Bitcoin values fell by 19% between January 1, 2020, and March 23, 2020. Furthermore, on March 13, 2020, Bitcoin saw its most significant one-day drop (36%). It is also observed that cryptocurrencies became less volatile after the second wave of COVID-19 (around June 2021).
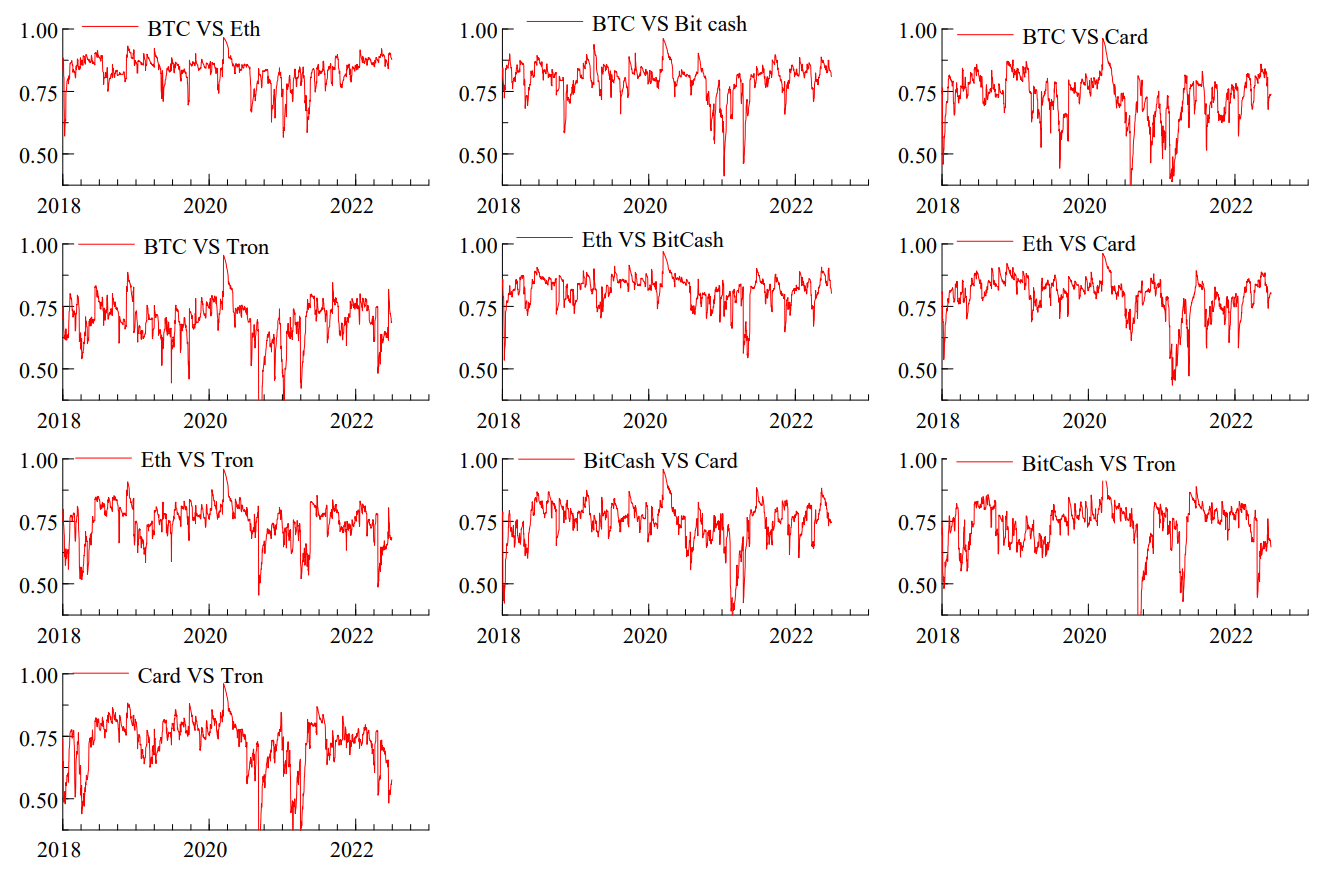
Further, we present the DCC-GARCH conditional correlations for the entire study period in Figure 2. By comparing all the cryptocurrencies (see Figure 2), we noticed they are significantly correlated to each other. The results are consistent with Naeem et al. (2022), who find significant correlations among cryptocurrencies during the COVID-19 pandemic.

IV. Conclusion
This study investigates the price stability and sequential regularity of five major cryptocurrencies during the pre-COVID-19 and COVID-19 pandemic using the DCC-GARCH methodology. Various statistical analyses were done to examine any changes in the cryptocurrencies’ behavior before and during the COVID-19 pandemic. We find that the pandemic has increased the volatility in cryptocurrency movements. Specifically, the cryptocurrencies demonstrates a strong mutual association in their behaviors during COVID-19. This suggests that digital currencies can be more volatile during uncertain and stressful scenarios. The paper also advocates that there could be similar reactions among the set of digital currencies. Hence, investors should be extra vigilant, while taking positions on digital currencies during uncertain times.
Acknowledgment
Comments from the editors, associate editors, and guest editors of Asian Economics Letters are gratefully acknowledged. The authors also acknowledge the suggestions from the anonymous reviewers.