I. Introduction
Central banks from more than 60 countries around the world have been exploring the use of Central Bank Digital Currencies (CBDCs) since 2014 (PWC, 2021).[1] Given the regulatory uncertainty around the cryptocurrencies as well as their rising environmental concerns, CBDCs are gaining momentum in the policy arena. The increased discussions on the prospects of the issuance of CBDCs have received significant media attention. Similarly, increased uncertainty on the potential impacts of CBDC issuance means that investors should be aware of the related portfolio implications and the financial market spillovers.
The cryptocurrency market has received significant investor attention (Smales, 2022). In the literature, cryptocurrencies’ popularity has grown around several features, such as (i) as a financial asset, (ii) as a portfolio diversifier, and (iii) as a medium of exchange (Bariviera & Merediz-Solà, 2021; Corbet et al., 2019). Given the role of cryptocurrencies as a safe haven asset (Dyhrberg, 2016), as well as the spillovers from cryptocurrency environmental attention to the conventional and green assets (Kamal & Hassan, 2022), investors may feel motivated to look for assets that hedge CBDC related uncertainty and attention because both CBDCs and cryptocurrencies are considered as competing assets.
Recently, to gauge the potential spillovers of the discussion on the CBDCs to the financial markets, Wang et al. (2022) developed CBDC uncertainty and attention indices using a large number of news articles from LexisNexis database. CBDC related uncertainty and attention indices can have a strong relation with cryptocurrencies, and this could have spillover effects on other asset classes as well. For example, Wang et al. (2022) find that CBDC uncertainty has a negative relationship with the MSCI World Banks Index, USEPU, and the FTSE All-World Index, and a positive relationship with cryptocurrency market volatility, VIX, and gold. They used a dynamic conditional correlations (DCC) via AR (1)-GJR-GARCH (1,1) model. Motivated by the above discussions, in this paper, we study how CBDC uncertainty and attention indices affect US bond, US dollar futures, and gold using the DCC-GJR-GARCH (1,1) model.
We contribute to the literature in two ways. First, our results have important policy implications for investors since CBDC uncertainty is new to the investors. For example, given a higher CBDC uncertainty, investors are unsure about which asset can hedge such uncertainty. Can digital or fiat currencies play a hedging role? We attempt to answer this question in our paper. Second, we reveal the potential impacts that CBDC uncertainty can have on the conventional monetary policy (Bank for International Settlements, 2018; Williamson, 2021). We attempt to understand how CBDC related uncertainty and attention can affect conventional monetary policy via interest rate channels (for example, through studying US bonds).
We find that US dollar hedges CBDC uncertainty completely, while the US bond hedges against CBDC uncertainty index subsequent to 2019. CBDC attention index exerts a negative impact on the assets in general. Importantly, gold does not hedge CBDC uncertainty.
This paper is organized as follows. Our next sections present data and methodology, results and conclusions.
II. Data and Methodology
A. Data
We use data on three assets and CBDC uncertainty index (CBDCUI), and CBDC attention index (CBDCAI). Three assets are USD futures (USDFUTURE), gold futures (GOLD), and 1-year US bond (USBOND). Baur & Dimpfl (2021) suggest that gold, US bonds, and US dollars are well known safe haven assets. We collect the data on CBDC uncertainty and attention indices from Professor Lucey website. The USDFUTURE, GOLD, and USBOND data are from investing.com (https://www.investing.com).
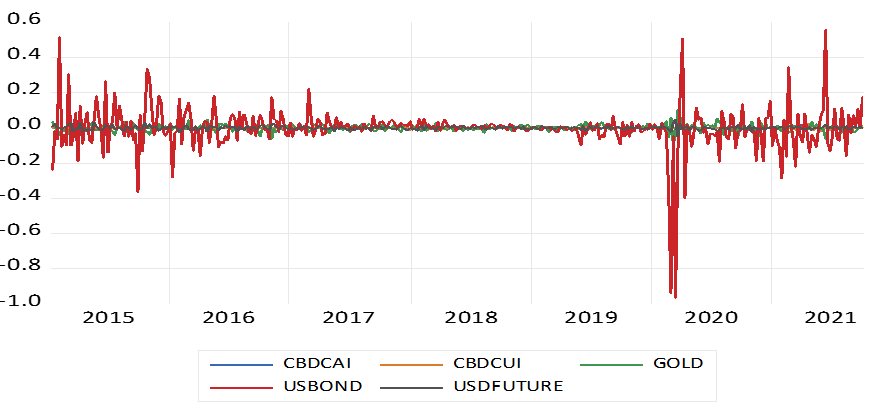
Our data include weekly observations of all variables from January 11, 2015, to October 3, 2021. The data availability determines the data frequency. Figure 1 shows that US bond is highly volatile. There is a stable period during 2017-2019.
Table 1 shows the descriptive statistics for the variables used in the estimation. GOLD has the highest mean, while USBOND has the highest standard deviation. The excess kurtosis statistic shows the variables have fat tails, and the Jarque-Bera statistic shows that variables are non-normally distributed. The variables are stationary based on the ADF test. The correlation matrix shows that CBDCUI and CBDCAI have insignificant correlation with the chosen assets.

B. Methodology
We applied the GJR-GARCH based model proposed by Glosten et al. (1993) with the DCC approach. In the first stage, we estimate the following equation:
Yt=μ+εt
εt/Ωt−1∼Sts(0,1)
where is the vector of variables in log first difference form; represents the vector of constants; and is the vector of residuals. Due to the high risk and non-normal asset distribution of the assets, as shown in the descriptive statistics, we applied the skewed student t-distribution for the errors (Nekhili & Sultan, 2020).
The conditional volatility of the GJR-GARCH model is as follows:
h2it=ω+αε2t−1+βσ2t−1+γε2t−1It−1
where if and otherwise The asymmetric effects of positive and negative shocks are represented by the leverage term Meanwhile, when and then volatility is positive and stationary in Equation (2).
In the second stage, according to Engle (2002), is as follows:
Ht=Dt1/2RtDt1/2
Rt=diag (Kt−12ktdiag (kt)−12
kt=(1−a−b)V+a diag (kt−1 )12ˆεi,t−1ˆε′i,t−1diag (kt−1 )12+b Kt−1
where refers to the conditional correlation matrix; defines the diagonal conditional variances; and are non-negative scalars that conform to the condition of has element in the following form:
ρij,t=qij,t√qii,tqjj,ti,j=1,2,⋯,n, and i≠j
For bivariate relationship, Eq. (6) becomes
ρ12,t=q12,t√q11,t q22,t
III. Results
A. DCC results
Table 2 presents the results of the DCC-GJR-GARCH (1,1) model.[2] ARCH and GARCH terms are positive and significant for all the variables in the estimation. Positive and significant GARCH term implies volatility persistence and clustering. The leverage term is negative and significant for CBDCUI, CBDCAI, and USDFUTURE. This suggests that negative news creates less volatility than positive news. The DCC term is insignificant for all the variable pairs, which suggests that there is no short run volatility clustering. Meanwhile, the DCC term is positive and significant for all the variable pairs. This implies that there is long term volatility persistence.
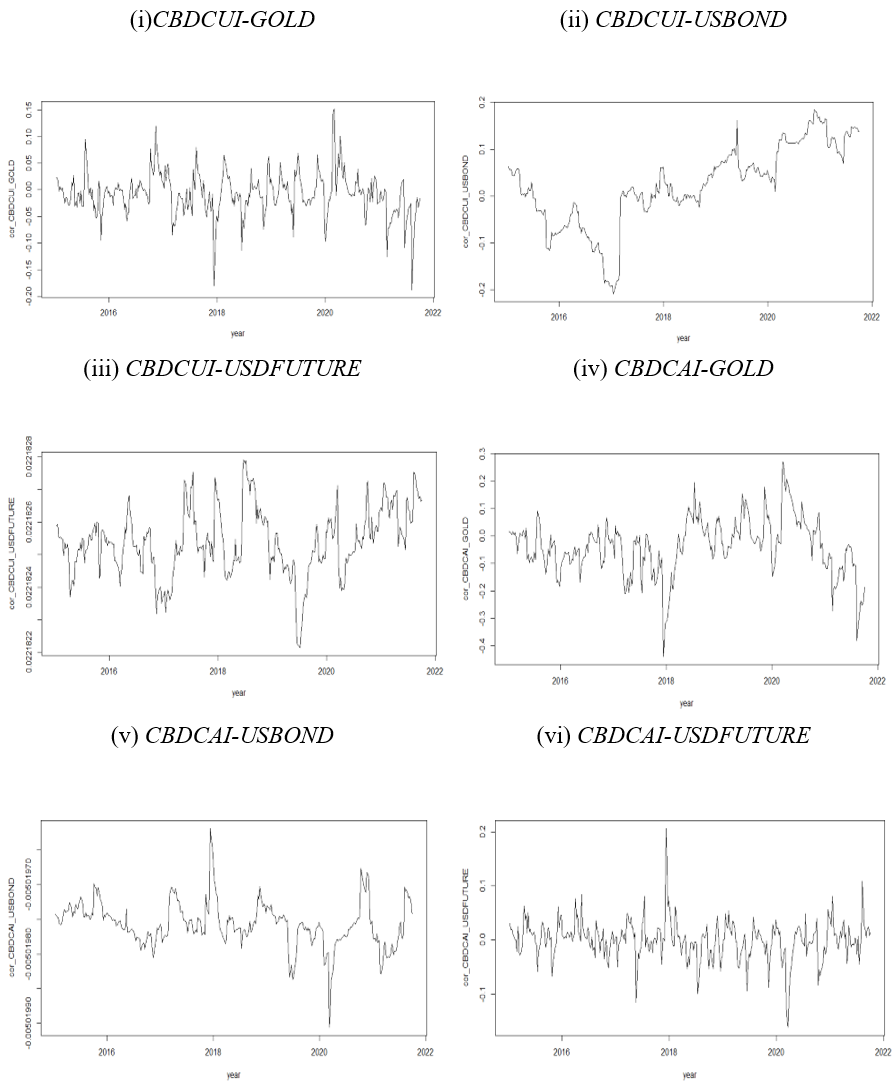
Figure 2 presents the time-varying DCC results. It is seen that GOLD has both positive and negative relationships with CBDCUI during the whole period. This suggests that GOLD is not a hedge against CBDCUI, which contrasts prior finding (Baur & Lucey, 2010; Wang et al., 2022). Increase in hedging costs may have led to the loss of safe haven properties for gold (Akhtaruzzaman et al., 2021). The USBOND hedges CBDCUI subsequent to 2019 and hence the hedging potential of USBOND is regime-dependent. Wang et al. (2022) observe few events that arose during 2019-2021, such as cryptocurrency bear markets, China-US trade war, and Cryptocurrency bull markets, which may have driven the positive shift in the DCCs between USBOND and CBDCUI during this period. The USDFUTURE is a hedge against CBDCUI over the full sample period because there is a positive relationship between them. Meanwhile, CBDCAI exerts both positive and negative effects on GOLD and USDFUTURE. However, CBDCAI exerts a negative effect on the USBOND over the entire period. Overall, there is a negative relationship between CBDCAI and the assets in general.

B. Sub-Sample analysis
Covid-19 has been identified as a black swan event. There were unprecedented policy responses from the governments to control the negative effects of Covid-19 on the financial markets across the world. These may have affected financial markets’ response to the policy related uncertainty. For this reason, we perform a sub-sample analysis to see whether our results are not affected by the high economic policy uncertainty period of Covid-19. We use pre-Covid-19 data from 11/2015 to 02/2020 to see how CBDCUI and CBDCAI affected the variables in the estimation. These results are available upon request. We find that gold is a hedge against CBDCUI for the pre-Covid-19 data, which contrasts our full sample analysis. This is consistent with the literature that gold has hedging capability during pre-Covid-19 period (Akhtaruzzaman et al., 2021). Interestingly, with the preCovid-19 data, USDFUTURE lost its safe haven properties against CBDCUI as compared to the full sample results. Meanwhile, the negative nexus between CBDCAI and the other variables prevails using the preCovid-19 data, which resembles the full sample results.
IV. Conclusion
In this paper, we study the hedging potential of gold, US bond, and US dollar futures against CBDC uncertainty and attention indices. We find that the US dollar consistently shows a positive association with CBDC uncertainty. The association is mixed (both positive and negative) between CBDC attention index and the US dollar. Importantly, gold is not a hedge against CBDC uncertainty, which is in contrast to the literature (Baur & Lucey, 2010). Additionally, gold exhibits a negative association with CBDC attention index. Finally, the US bond hedges CBDC uncertainty only subsequent to 2019, while it shows a consistent negative association with the CBDC attention index. Our findings suggest that policy makers should be aware of the potential negative impacts of the CBDC indices, particularly the attention index. Future research may focus on other asset classes and alternative econometric models, such as quantile-based analysis, to capture spillovers from CBDC uncertainty and attention indices to financial markets in different market states.
Acknowledgement
We thank the anonymous reviewer and the editor for their comments, which improved the quality of the paper significantly.
Our GJR-GARCH with skewed student t-distribution model is found to have the lowest AIC. For the sake of brevity, we did not present the results of the alternative GARCH models’ (i.e., GARCH, EGARCH, and IGARCH) results with skewed student t-distribution for error terms. We also test whether student-t or skewed student-t performs well for GJR-GARCH model and find that skewed student-t errors perform well. These results are available upon request.