I. Introduction
Several wars, such as the Israel-Arab Coalition War (1970s), the Iran-Iraq War (1980s), and the Iraq-Kuwait War (1990s), caused significant oil-supply disruptions in the past, leading to significant spikes in the prices of crude oil in the global oil market and subsequently economic crises (recessions) in most oil-importing countries (Baumeister & Kilian, 2016). The ongoing Russia-Ukraine War is not an exception. The war, accompanied by a series of sanctions on Russia, led to a significant increase in the price of crude oil. It is on record that the war began on February 24th, 2022, when Russia launched the military invasion of Ukraine (Raifu, 2022). As a result of the war, Brent crude oil price (WTI crude oil price) rose by 22.40% (23.10%) between February 24th, 2022, and March 24, 2022. This signifies a historical increase in the price of crude oil since the second quarter of the year 2014 when the price of crude oil nosedived by 50%.
Such a hike in the price of crude oil has a significant detrimental effect on different sectors of the economy including the financial sector. The theoretical link between the oil price and stock price was first acknowledged by Jones and Kaul (1996). The theoretical link is situated within the framework of the cash flow hypothesis (Salisu et al., 2019). The hypothesis postulates an inverse relationship between oil prices and stock prices and returns (Degiannakis et al., 2018). Given this relationship between the two series, a considerable number of studies investigated the causal-impact nexus between oil price (returns) and stock price (returns) employing different estimation methods (see, for example, Prabheesh et al., 2020). However, Smyth and Narayan (2018), in their review, submitted that the findings remain inconclusive.
In light of this, this study contributes to existing studies by testing the hypothesis of no structural changes (or breaks) in the relationship between oil prices and stock prices during the ongoing Russia-Ukraine War, by focusing on 13 oil-importing Asian countries, which include Bahrain, China, India, Indonesia, Japan, Jordan, South Korea, Malaysia, Pakistan, Singapore, Taiwan, Thailand, and Vietnam. Our study is motivated by the fact that it has been observed that global events, such as the Global Financial Crisis (GFC), the COVID-19 pandemic, and the ongoing Russia-Ukraine War, do have significant effects on the relationship between oil and stock prices. Such effects subject the relationship between the two series to structural changes, which could have implications on inference and policy decision-making (Karavias et al., 2022). We approach this study in two ways. First, we test the null hypothesis of no structural changes (or breaks) between the two variables in the individual and the panel of Asian oil-importing countries. To test the null hypothesis, we adopt the structural break estimation method developed by Ditzen, et al. (2021). Second, we estimate the coefficients of each detected breakpoint, which show the effect of change in oil price on the stock price.
The rest of the paper is organized as follows. Section II presents the data sources and methodology. Results are presented in Section III while Section IV concludes.
II. Data Sources and Methodology
A. Data Sources
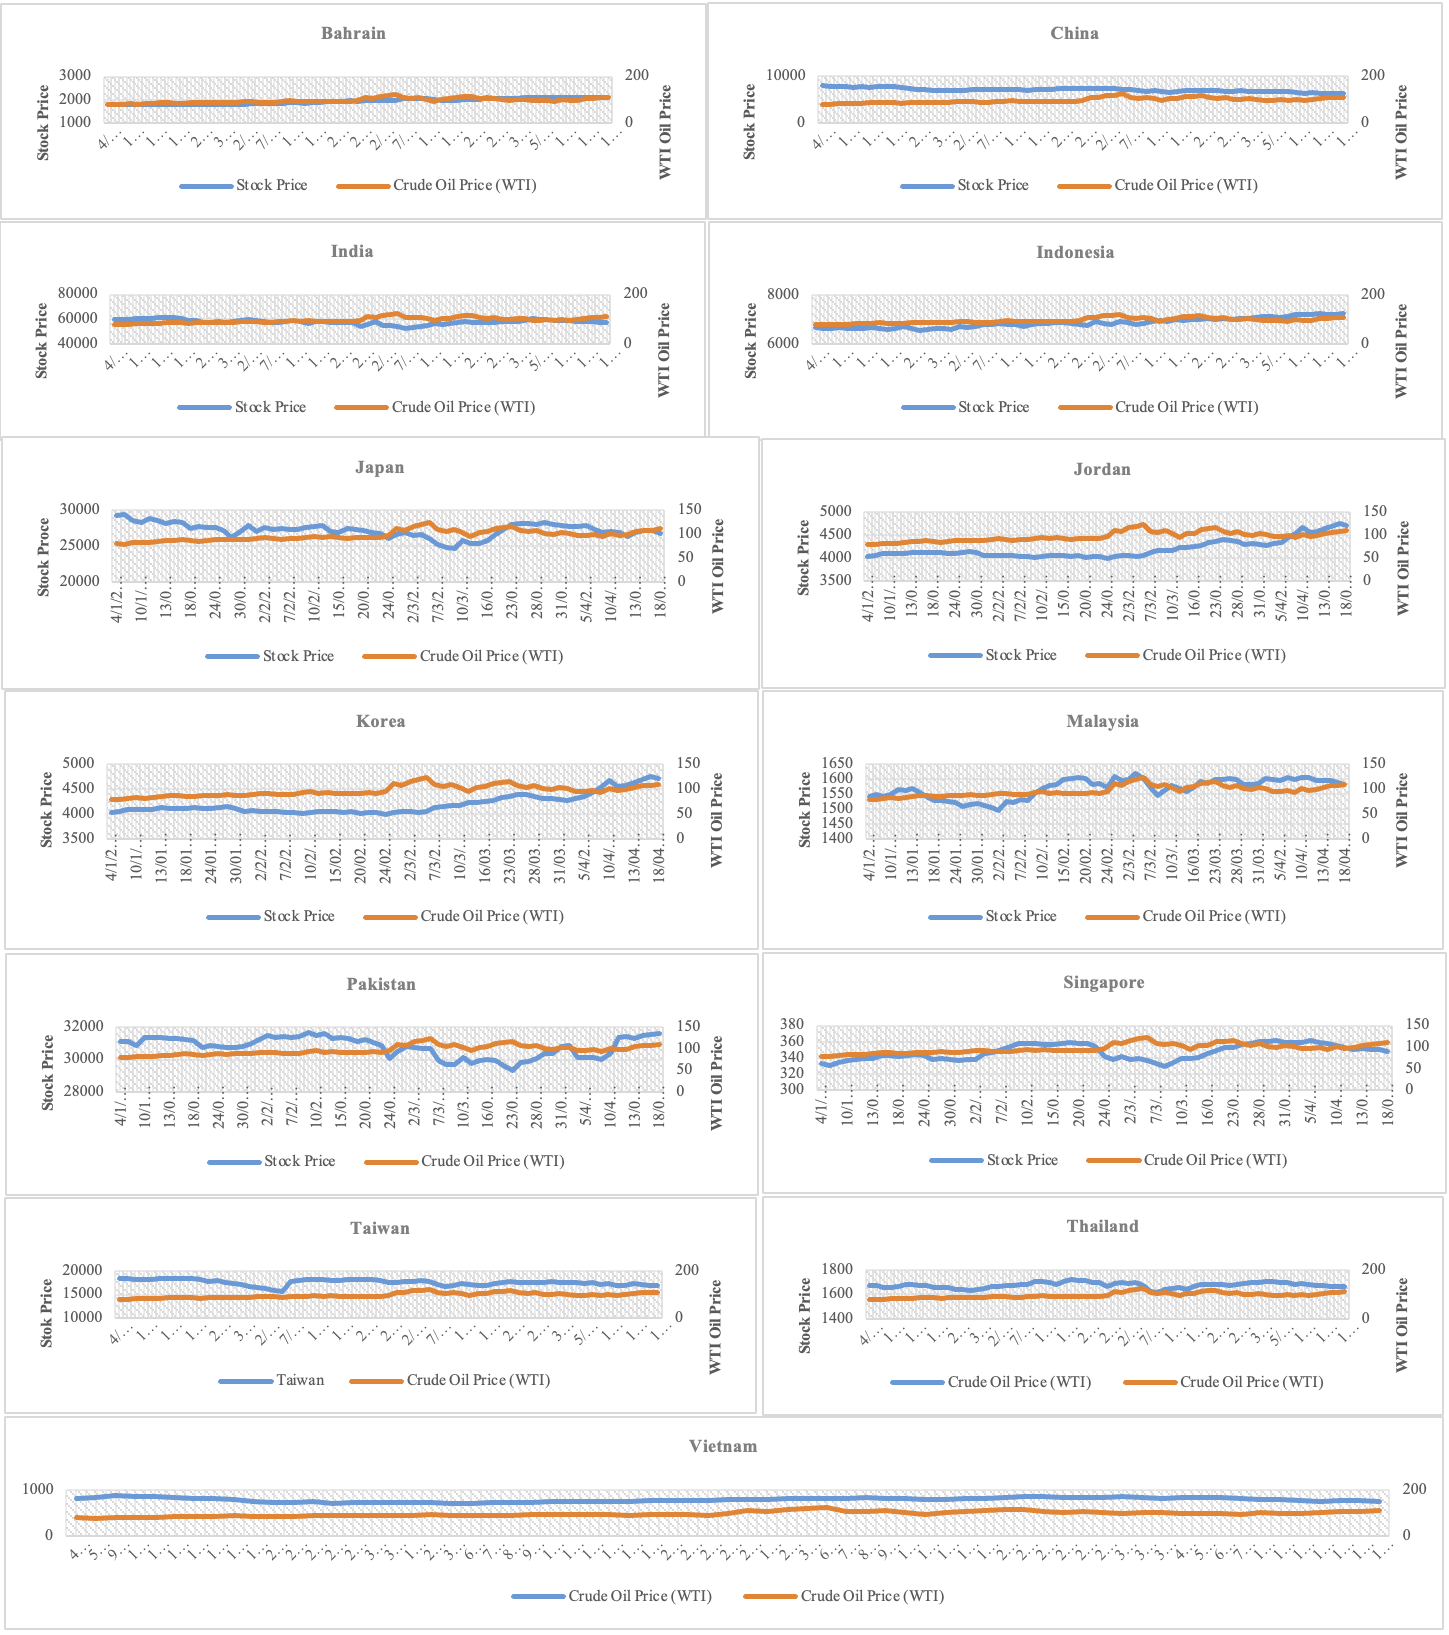
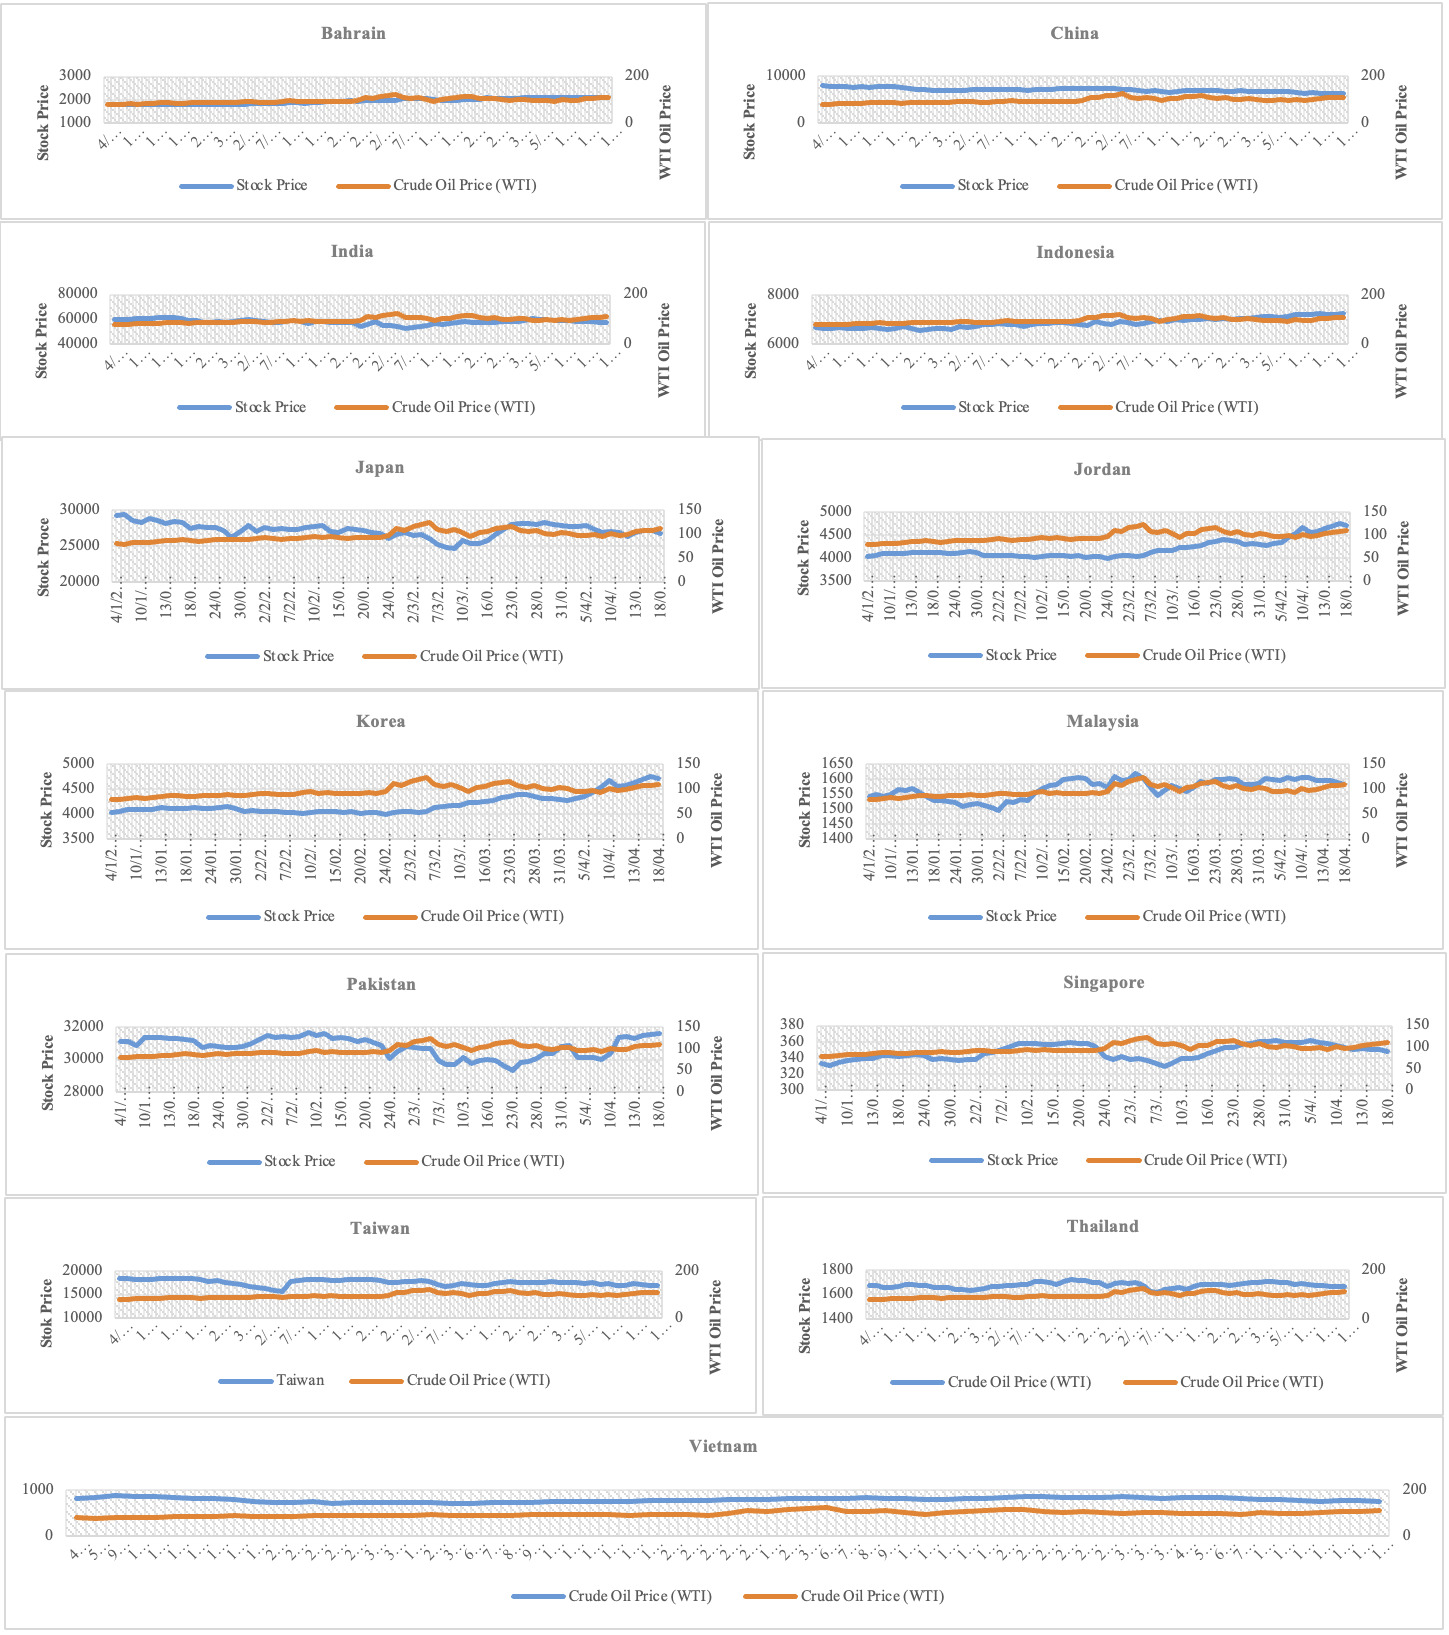
To detect the breakpoints in the oil price-stock price nexus, we use daily data on stock prices of 13 oil-importing Asian countries covering the period from January 4, 2022, to April 18, 2022. We also use daily data on the West Texas Intermediate (WTI) oil prices. The data on stock prices are obtained from https://www.investing.com, while WTI oil price data is obtained from the Energy Information Administration. Figure 1 shows the trend of the relationship between oil price and stock prices in all 13 oil-importing countries.
B. Methodology
Our methodological approach to testing the null hypothesis of no structural breaks in the oil price-stock price nexus in the 13 oil-importing Asian countries follows Ditzen et al. (2021). Assume we have a linear model with units, periods, and structural breaks, specified as follows:
yit=x′itαi+εit
where denotes stock price, denotes oil price, with and We could have break or regimes with the regime The regime covers the observations The regime-wise of the structural break for Equation (1) can be written as:
yit=x′itα1+εit for t=T0,…,T1, yit=x′itα2+εit for t=T1,…,T2∙∙∙yit=x′itαs+1+εit for t=Ts,…,Ts+1
If Equation (1) is a time series model and if then it is a panel model. In this study, we assume that the coefficient of oil price is not affected by the Russia-Ukraine War. Therefore, there are no structural breaks that cause the structural change in the relationship between oil price and stock price. The alternative hypothesis is that the coefficient of oil price is affected by the Russia-Ukraine War, which leads to structural breaks that cause the structural change in the nexus between oil price and stock price. The implementation of Dizten et al. (2021) involves two processes. The first is to detect the number of structural breaks in the relationship between oil price and stock prices. This generates a series of independent series (oil price) based on the number of detected break dates. The second approach is to use any estimation technique to ascertain how oil price influences stock prices along the structural break dates. In this study, we apply the ordinary least squares estimation method.
III. Empirical Findings
We present the estimated break dates for each of the countries and the overall panel in Table 1. As displayed in Table 1, we rejected the null of zero breaks in favour of at least one break in all the countries included in our sample. That is, there is evidence of at least one break point in each of these Asian economies. Specifically, we find evidence of one break date in Thailand, which occurred on 6 February, 2022, and two break dates in Malaysia occurring on 18 January, 2022 and 9 February, 2022. Other countries, such as India, Indonesia, and Singapore, have at least three breaks each. Moreover, we also find evidence of four break dates in the case of Japan and Taiwan, whereas other countries, such as Bahrain, China, Jordan, South Korea, Pakistan, and Vietnam, indicate the evidence of five break dates (see Table 1 for the specific break dates). Furthermore, the estimated break dates for the overall panel as displayed in the last row of Table 1 confirmed the rejection of no breaks in favour of the alternative of five breaks in all the sampled Asian countries. Moreover, comparing these results to those of the time series data, it can be observed that the first break date in China corresponds with the fifth break in the panel data, and the first breaks in India, Japan, Malaysia, Pakistan, and Vietnam match with the fourth break in panel data. Therefore, the evidence from the panel data supports two of the break periods as suggested by the evidence for the time series data. Nevertheless, it also indicates that one to four breaks are not sufficient, and there is the need to include a fifth break. These outcomes are consistent with the findings documented in Ditzen et al. (2021). Following this result, we therefore concluded that there are five breaks between crude oil price and stock price that are likely caused by the crude oil crisis occasioned by the Russia-Ukraine War.
Next, we present the estimated results by accounting for each of the break regimes with the aid of OLS for the time series data and pooled OLS for the panel data. The results are shown in Table 2. Starting with the time series results, we find, that for the first regime, there is a negative relationship between oil price and stock price in eight of the thirteen countries, but the relation is only statistically significant in the case of India, Taiwan, Thailand, and Vietnam, whereas the relation is positive in the remaining economies, but significant only in the case of China, Jordan, and Pakistan. In addition, except for Bahrain, the nexus maintains its sign/direction and significance in the other regimes for all the countries. However, the nexus appear to be weaker as one progresses from the first regime to the fifth regime in the case of China and Thailand, while the results are mixed in other countries. Specifically, the effects of structural breaks on stock returns indicate that for 1000 points of regime shock, stock returns declines by 4 points in Bahrain, 94 points in India, 53 points in Japan, 47 points in South Korea, 14 points in Singapore, 77 points in Taiwan, 65 points in Thailand and 152 points in Vietnam; whereas stock returns improves by 104 points in China, 19 points in Indonesia, 110 points in Jordan, 5 points in Malaysia, and 126 points in Pakistan, in the first mean effect without structural breaks. The results further reveal that except in the case of Bahrain, all Asian economies that experienced the negative impact of structural break in the first regime maintained the impact in the subsequent regimes, and those with positive impacts in the first regime also retain similar responses in the succeeding regimes. The results here are in line with Ditzen et al. (2021), who documented that the COVID-19 related deaths decline as COVID-19 cases move from the first coronavirus regime (first wave) to the third regime (third wave). Considering the results for the overall panel, we find mixed outcomes; that is, the impact is positive and significant in the first and second regimes, but negative and significant in the third and sixth regimes. To be specific, a 1000 points intensity in structural breaks due to the war improves the overall stock returns in these Asian economies by 187 points in the first mean effect without structural breaks, 416 points in the second regime, 294 points in the fourth regime, but stock returns decline in the first regime by 123 points, 565 points in the third regime, and 304 points in the fifth regime. These results portend that the Russia-Ukraine War increased the volatility in the crude oil market, which further exacerbated the instabilities in the stock markets of these Asian economies.
IV. Conclusion
This paper investigates the spillover effect of oil price volatility on stock returns during the Russia-Ukraine War, focusing on 13 oil-importing Asian economies. Our results confirm the evidence of structural breaks in the stock price–oil price nexus ranging from one to five break dates. Also, the regression results from the different regimes show that the spillover effects intensify in some countries but decline in others from the first to the fifth regimes, while the results are mixed in some countries and for the panel estimation. Our results are in consonance with the fact that the incursion by Russian forces into Ukraine has had undulating effects on humanitarian and economic activities globally. Specifically, the energy sector is most susceptible and then spills over to other sectors of the economy (the stock market, in particular). Our mixed results suggest that the ongoing Russia-Ukraine War affected the energy sector and stock markets globally; however, the effect is non-uniform across countries. These findings provide evidence that the stock price–oil price nexus intensified following the war in Ukraine. The policy implication from this is that, over the medium to the long term, the energy sectors in these Asian countries should build up resilience and importance in the current evolving energy world. Also, we recommend policymakers to provide support for the financial markets through securing domestic capital financing, protecting against major manmade and environmental catastrophes, and insuring against wars and pandemics.