I. Introduction
Climate change mitigation policies in the emerging Asian economies are faced with both opportunities and challenges (Fankhauser & Jotzo, 2018; Gouldson et al., 2016). In this study, we investigate the opportunities provided by renewable energy transition and innovation, as well as, the challenges posed by corruption, political instability, and increasing population density, in the face of climate change in these economies. Climate change has become a rising concern in the emerging Asian economies due their inability to decouple economic growth from the rising CO2 emissions (Wang & Jiang, 2020; Zhao et al., 2022). This problem is compounded by the rising population density in these countries (Harper, 2019). The energy systems play a key role in dealing with the problem of climate change, while maintaining the growth momentum (Cronin et al., 2018; Foster & Elzinga, 2013; Hasan et al., 2013; Mujtaba, Jena, Bekun, et al., 2022; Mujtaba, Jena, Mishra, et al., 2022; Stephenson, 2018).
The energy mix in the emerging Asian economies is gradually transitioning towards cleaner and renewable sources, but the existing factories and plants still generate a very large amount of fossil fuel (Fekete et al., 2021; Sharvini et al., 2018). Both renewable energy and energy efficiency through technological innovation provide opportunities for a low-carbon future and economic growth (Gielen et al., 2019; Jena et al., 2022; Pigato et al., 2020). But institutional bottlenecks like corruption and political instability pose challenges for clean energy transition in these economies (Mahjabeen et al., 2020; Mahmood et al., 2021). In implementing renewable energy, these countries face various policy challenges like high fossil fuel subsidies, lack of political incentives, high set-up costs, lack of environmental regulatory frameworks, complicated tariff structure, small economies of scale, market uncertainties and many more (Mahmood et al., 2021). These policy-related factors determine the energy transition process and can be reasonably dependent upon the political domain.
Therefore, whether renewable energy and governance factors affect the growth potential and environmental conditions in these economies, remains an alluring question among researchers in the recent times (Bhattacharya et al., 2017; Haldar & Sethi, 2021, 2022; Salman et al., 2019). However, these studies have mostly focused on either climate change or economic growth (Hanif et al., 2019). Simultaneously incorporating both factors is important for policy formulation towards environment friendly economic growth. It is crucial to analyze how renewable energy consumption, technological innovation, and governance factors contribute to the energy and economic profiles of the emerging countries of Asia. The current study is a novel attempt to reconcile both the problems of sustaining economic growth and mitigating climate change for these emerging economies.
In this analysis, our main objective is to compare the opportunities provided by renewable energy and innovation for increasing economic growth (GDP) and reducing CO2 emission (CO2), with the challenges posed by corruption and political instability for emerging Asian economies from 2000 to 2018. Since we have two dependent variables, GDP and CO2, which are endogenously related, we use both panel autoregressive distributed lag (ARDL) for single-equation estimation and the three-stage least squares (3SLS) for estimating simultaneous equations with a common set of regressors. From our analysis, we find that the emerging Asian economies need to increase the use of renewable energy in order to benefit from the economies of scale for enhancing growth and reducing emission. Innovation is found to have insignificant effects on the economy but adverse effects on the environment, while trade is found to have adverse effects on both the economy and environment of these economies. This suggests that these economies should alter their export-import mix to realize the growth effects of trade, while reducing environmental degradation. Both corruption control and political stability are found to be beneficial to both the economy and the environment of the emerging economies.
The analysis is divided into four sections including the present one. The methodology and data for estimation are given in Section II, followed by the empirical findings in Section III, and conclusion in Section IV.
II. Methodology and Data
A. Methodology
For the empirical analysis, we estimate two separate single-equations using the panel-ARDL estimator and the system of equations using the 3SLS estimator. The dependent variables in these equations are economic growth and CO2 emission. We analyze the effects of renewable energy consumption (REC), innovation and governance on CO2 emission and economic growth (LNGDP) in seven emerging Asian economies over 19 years (2000-2018). Apart from the common regressors in both the regression Equations (1) and (2), population density (PD) is included in Equation (1) as the determinant of CO2 emission, while human capital (HC), capital stock (CAP), and per unit labor productivity (EMP) are included in the growth equation, i.e., Equation (2). The mean group (MG) model specification for the above estimation problem is as follows:
(CO2)it=∅i+∝1GDPit+∝2TPAit+∝3RDit+∝4RECit+∝5NRECit+∝6TRDit+∝7PDit+∝8CORRit+∝7PSit+uit
(LNGDP)it=µi+β1CO2it+β2TPAit+β3RDit+β4RECit+β5NRECit+β6TRDit+β7CORRit+β8PSit+β9CAPit+β10HCit+β11EMPit+vit
where innovation is proxied by total patent applications (TPA) and research and development expenditures (RD); governance is proxied by corruption control (CORR) and political stability (PS). NREC, TRD, CAP, HC and EMP denote non-renewable energy consumption, trade(%GDP), capital stock, human capital and per-unit labor productivity respectively.
The pooled mean group (PMG) and dynamic fixed effects (DFE) long-run relationship specifications for Equations (1) and (2) are as follows:
(CO2)it=∅i+p∑j=1πij(CO2)i,t−j+q∑j=1∝ijGDPi,t−j+q∑j=1∝ijTPAi,t−j+q∑j=1∝ijRDi,t−j+q∑j=1∝ijRECi,t−j+q∑j=1∝ijNRECi,t−j+q∑j=1∝ijTRD+q∑j=1∝ijPDi,t−j+q∑j=1∝ijCORRi,t−j+q∑j=1∝ijPSi,t−j+uit
(LNGDP)it=θi+p∑j=1λij(LNGDP)i,t−j+q∑j=1βij(CO2)i,t−j+q∑j=1βijTPAi,t−j+q∑j=1βijRDi,t−j+q∑j=1βijRECi,t−j+q∑j=1βijNRECi,t−j+q∑j=1βijTRD+q∑j=1βijCORRi,t−j+q∑j=1βijPSi,t−j+q∑j=1βijCAPi,t−j+q∑j=1βijHCi,t−j+q∑j=1βijEMPi,t−j+vit
The panel ARDL estimation can only be performed when all the variables are stationary either at levels or the first differences. Therefore, it is important to test the stationarity of the variables before proceeding to the panel ARDL estimation. Since the data is found to exhibit cross-sectional dependence, we performed both Cross-sectionally Augmented Im, Pesaran and Shin (CIPS) and Covariate-augmented Dickey Fuller (CADF) unit root tests, to test the stationarity of the variables. All the variables are found to be either I(0) or I(1). Further, the panel ARDL model is found to be more appropriate when other estimators like the instrumental variables, Generalized Method-of-Moments (GMM), and fixed effects might produce inconsistent results. The estimated model in the current analysis is of the form ARDL(p,q,q,…,q), where p is the number of dependent variables and q the number of independent variables. We employed the PMG, MG, and DFE estimators to investigate the effects of renewable energy consumption, innovation, corruption control, and political stability on CO2 emission and economic growth of seven emerging Asian economies. However, we observe that CO2 and GDP are endogenous variables, therefore, we also estimate both Equations (1) and (2) simultaneously using the 3SLS estimation technique. We use both the single-equation and simultaneous-equation estimations to draw policy implications for climate change mitigation and sustainable economic growth.
B. Data
Data have been compiled for seven emerging market countries in Asia from 2000 to 2018, selected as per the latest Morgan Stanley Capital International (MSCI) Emerging Markets Asia classification[1] (China, India, Indonesia, Korea, Malaysia, Philippines, and Thailand). The study uses CO2 as a measure of global warming or climate change, since CO2 is the primary greenhouse gas (GHG) emission and causes global warming (Ritchie et al., 2020). The natural logarithm of GDP (LNGDP) is considered as economic growth. Trade (TRD) is included in both Equations (1) and (2) due to its potential effects on both the economy and environment. The data for CO2, GDP, TPA, RD, and TRD are extracted from the World Development Indicators database of World Bank. The data for CORR and PS are compiled from the World Governance Indicators database. The data for REC and NREC are compiled from International Energy Agency (IEA) database. Data for HC, CAP, and EMP are compiled from the Penn World Tables (PWT 10.0).
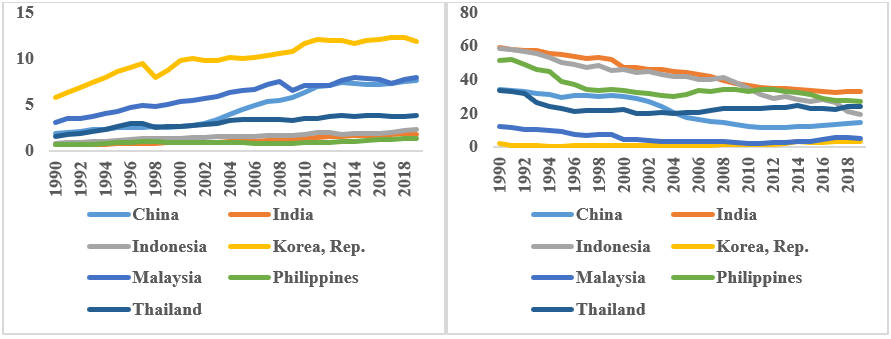
The trends of CO2 emission and renewable energy consumption in the major Asian emerging countries are shown in Figure 1.
_and_renewable-energy_consumption_(*right*).png)
Figure 1 shows that, for the countries China, Malaysia and Korea, CO2 emission per capita has increased over time. These countries have also reduced their shares of renewable energy consumption in their energy profiles. Countries like India, Philippines and Thailand still have relatively higher levels of renewable energy share in total consumption. However, it is clear that, with the increasing pressure on energy demand resulting from the higher growth rates in these emerging markets, the share of renewable energy has reduced over time (Figure 1). This is probably due to the lack of proper infrastructure for storing and conserving renewable energy in these countries (Eyuboglu & Uzar, 2022).
III. Empirical Findings
Before proceeding to estimation using the panel ARDL estimator, we conduct a cross-section dependence (CSD) test followed by an appropriate panel unit root test to ensure that all the variables are first-order stationary. The CSD test results are provided in Table 1.
Table 1 shows that our empirical model exhibits CSD and hence second-generation unit root tests like CIPS or CADF will be appropriate. The results of the CIPS and CADF unit root tests are presented in Table 2.
Table 2 shows that all the variables are first-order stationary and therefore we can use the panel ARDL estimator for our estimation. We estimate Equations (1) and (2) separately using the PMG, MG and DFE specifications. The results are given in Table 3.
In Table 3, all the estimates of Equation (1) show that GDP, RD, NREC, TRD, and PD increase CO2, while REC and CORR reduce CO2 emission. Similarly, the estimates of the growth equation, i.e., Equation (2), show that CO2, REC, CORR, PS, and HC increase economic growth, while TRD reduces it. Therefore, we find that renewable energy consumption, corruption control, and political stability are beneficial to both economic growth and environmental sustainability in the emerging Asian economies. This is similar to the recent findings of Mahmood et al. (2021) for the South-Asian economies. Additionally, our findings suggest that human capital has the potential to augment economic growth, while international trade should consider reallocating the mix of goods and services to prevent environmentally harmful imports and encourage economically beneficial exports.
In Table 4, we provide the estimates of the simultaneous Equations (1) and (2) using the 3SLS estimator.
From Table 4, we find that the simultaneous-equation estimates of Equations (1) and (2) are similar to the panel ARDL single-equation estimates. Even though the effect of GDP on CO2 is significant and positive, the coefficient value is very small for these emerging economies (0.0002); however, the effect of CO2 on economic growth is quite large (0.1124) and significant. It is alarming that the effect of RD on CO2 is also very large (0.6988), thereby suggesting the need for energy efficiency in the innovation process of these emerging economies. As expected, REC reduces CO2, while NREC increases CO2. We find that both corruption control (CORR) and renewable energy (REC) provide the win-win solution for mitigating climate change and increasing economic growth. This is also supported by other recent studies (Haldar & Sethi, 2021; Mahmood et al., 2021).
IV. Conclusion
The analysis concludes that renewable energy transition and corruption control benefit both the economy and the environment. However, corruption control remains a challenge for the emerging Asian economies due to political motives and the lack of transparency in governance. Since CO2 emission is a significant determinant of growth, these rapidly growing economies often use fossil fuel to meet their short-term energy demands without long-term considerations for sustainable growth. Since our analysis shows that non-renewable energy consumption is a significant driver of emission, short-term switching from fossil fuel to clean energy alternatives is suggested, while strengthening the infrastructural base of renewable energy for realizing long-term economies of scale. These countries should divert innovation towards energy-efficient techniques and should not be solely driven by growth motives. The mixture of goods and services in the export-import basket should also be reallocated to prevent the import of environmentally sub-standard products to reduce emission and increase growth. The opportunities and challenges encountered by these economies need to be considered, while planning for economic development and climate change mitigation.