I. Introduction
Cryptocurrencies are attracting the attention of Islamic investors around the world due to rising concerns about disruptive digital technologies such as blockchain. One remarkable feature of cryptocurrencies is their extremely volatility behavior. The emergence of Bitcoin as a leading cryptocurrency has attracted research from across the world and there is an ongoing debate about the legality and permissibility of cryptocurrency in Islamic finance. (Adam, 2019; Alam et al., 2019; Habib & Adekunle, 2019; Lateh & Rejab, 2021).
It is worthy of note that Islamic scholars remain divided on the legality of cryptocurrency and do not have a unanimous stance on its permissibility. Khan (2022) holds that cryptocurrency does not qualify as money in Islam as it does not possess any intrinsic value and its prices are highly volatile, which opens the door for speculation. His controversial findings reveal that cryptocurrency is not compatible with Islamic principles, and that it is not legal tender as it is not backed by any government. Thus, he concludes that Muslims should avoid investing in it. Dar Al-Ifta’[1] (2022) deems cryptocurrency as not Shariah-compliant due to its decentralized features and the high level of uncertainty associated with it, known as 'gharar’ in Islamic finance. According to Wifaq al-Ulama (2018), the fact that cryptocurrency has to be decentralized means that the method used to validate the transactions is based on gambling and chance. This view is consistent with Al-Qaradaghi (2018). On the other hand, Bakar (2018) and Abu-Bakar (2018) opine that cryptocurrency is permissible in principle. They argue that its volatility is not a valid reason to claim that it is not Shariah-compliant. The acceptance of cryptocurrencies is still debatable in the context of Islamic finance.
It is still unclear how cryptocurrencies affect Islamic indices during extreme events. This paper adds to the literature by filling the research gap on the behavior of Bitcoin and major Islamic indices during two major events, namely COVID-19 and the Russia-Ukraine war - seen as recent shocks on the financial markets. Bitcoin and Islamic stock markets can play important roles in portfolio diversification and financial risk management due to their investment features and hedging characteristics.
This paper attempts to explore the benefits of Bitcoin in Islamic portfolio diversification by analyzing the multi-horizon relationship between Bitcoin, as a leading cryptocurrency, and nine major regional Islamic stock indices. Therefore, this study investigates the behavior of these two alternative markets and how they relate with each other specifically during shocks for two reasons. First, Bitcoin is a new and unique alternative for investment. Second, the inclusion of such diverse Islamic equity indices based on different regions sheds some light on international investors’ decisions since Bitcoin is a very speculative investment and its volatile returns are expected in various international stock markets.
The remainder of the paper is organized as follows. Section II reviews existing literature. Section III presents the data and the methodology. Section IV discusses empirical results. Section V concludes the paper.
II. Literature Review
Digital assets, cryptos, and Islamic equities, with their unique features and behavior against traditional asset markets, have gained attention for their empirical contributions to portfolio diversification of risk and return trade-off (Bahloul et al., 2021; Kenourgios et al., 2016; Lim & Masih, 2017; Rehman et al., 2020).
The recent COVID-19 pandemic and its effect on economics and finance has attracted many studies (Chen et al., 2020; Phan & Narayan, 2020; Rubbaniy et al., 2021; Sha & Sharma, 2020). It has also motivated institutional and individual investors to look beyond traditional investments such as bonds and shares (Bahloul et al., 2021; Chen et al., 2020; Chkili et al., 2021; Matos et al., 2021; Rehman et al., 2020; Rubbaniy et al., 2021).
Rubbaniy et al. (2021) and Chen et al. (2020) suggest that Bitcoin does not exhibit safe-haven properties during extreme crisis periods. Mensi et al. (2020) find possible diversifications between Bitcoin and Islamic equity markets which vary across time and frequencies. In the long term, Bitcoin leads Asia-Pacific Islamic stock markets. Ahmed (2021) finds that, for emerging markets, Bitcoin’s downside lagged volatility has positive effects on returns across the Islamic market.
The current literature which analyses the relationship between Bitcoin and Islamic stock indices is still scant and inconclusive. It is still unclear how Islamic indices are impacted by cryptocurrencies, specifically during recent shocks such as COVID-19 and the Russia-Ukraine crisis. Thus, our study makes a relevant contribution to the existing literature. The interaction between Bitcoin and Islamic stock returns is still an ongoing phenomenon, producing sometimes contrasting empirical results that may lead to new theoretical perspectives.
III. Data and Methodology
We collect daily data from Bloomberg for Bitcoin, namely BTC and XBTUSD (BTC Currency expressed in USD) and nine major Dow Jones Islamic stock indices namely DJIM (World Markets), DJIAP (Asia Pacific Markets), DJIEU (European Markets), DJIMENA (MENA[2] Markets), DJIDEV (Developed Markets), DJIEMG (Emerging Markets), DJIGCC (GCC[3] Markets), DJI100X (top 100 firms Index) and DJIMGTUP (World Technology Emerging Markets).
The period spans from 20 July 2010 to 20 May 2022 with 3089 observations covering two major shocks: COVID-19 (March 2020) and the Russia-Ukraine war (February 2022).
Section 1 of Table A (Appendix) reports descriptive statistics of the variables used in this study. The variables, BTC and XBTUSD returns, have an average of 1.8 x 10⁻³ whereas their maximum values are respectively equal to 0.301 and 0.225 and minimum values equal to -0.261 and -0.261. The highest of mean returns of the nine studied indices is 2 x 10⁻⁴ realized by the DJIMGTUP (Dow Jones Islamic Market World Technology Emerging Markets).
The volatility of BTC and XBTUSD is similar for the two assets (value equals to 0.028 and 0.027) during the whole period. This value hides higher moments of volatility that these two assets can experience during the two major shocks under review.
The kurtosis values of all considered assets vary from around 3 for Asia Pacific markets to around 60 for MENA markets. The latter market may not follow a normal distribution.
Section 2 of Table A (Appendix) reports the correlation coefficients of the studied assets. The correlation between BTC, XBTUSD and the Islamic indices does not exceed the absolute value of 0.108, which shows that this low correlation may open a channel for possible diversification between Bitcoin and Islamic indices. The key variable of interest is BTC, which has a positive relationship with all Islamic stock indices and is very low and statistically significant. No negative correlation between the assets is found. However, BTC and XBTUSD are highly and positively correlated. This helps to limit our analysis to the relationship between BTC and the Islamic indices.
Based on Rubbaniy et al. (2021) and Mensi et al. (2020), a multi-scale analysis dedicated to study the relationships of the variables for the considered period using wavelet techniques is applied. Wavelet analysis represents a powerful tool for analyzing time series on frequency range and time scales simultaneously. The returns are calculated as difference of the logarithm of daily prices.
IV. Results and Interpretations
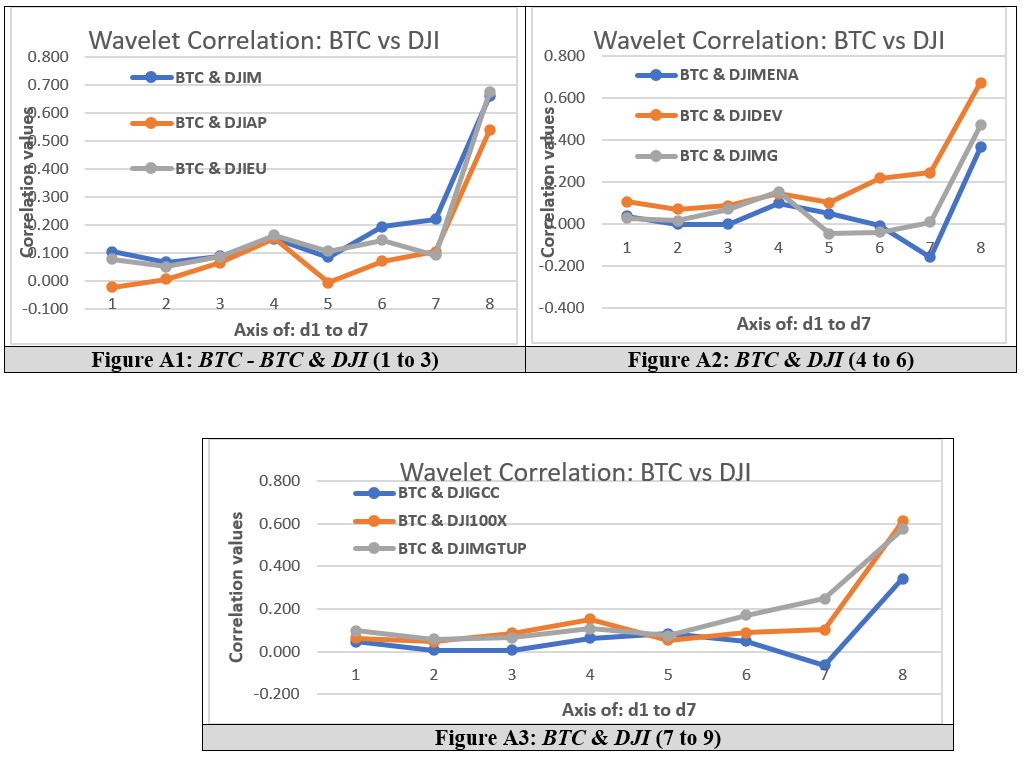
Table 1 and Figure A (Appendix) present Wavelet correlations between BTC and all nine Islamic stock indices.
Our main empirical results show a very low relationship between BTC and Islamic markets at all short-term time scales (d1 to d7). Overall, the wavelet correlation between BTC and the Islamic markets varies over investment horizons but remains very low especially in the short term. In the long term (s7), we observe similar pattern of correlation between BTC and the following markets: European, developed, and world emerging and technological values. The same similarities can be seen in the case of MENA, GCC, and Asia Pacific markets showing less integration of the regions with technological markets.
Section 2 of Table A and Figure A (see the Appendix) present the correlations results. Unlike those obtained in the matrix correlation for the whole period, our main empirical results show that the correlation between BTC and the Islamic markets varies over different horizons but remains low. However, the magnitude of the correlation is moderate compared to the correlation between BTC and Islamic stock indices, indicating that the BTC and Dow Jones Islamic markets are found to be fundamentally different in the short term as they are quasi dis-correlated. Our results suggest that BTC can be an instrument for Islamic portfolio diversification only in the short term. However, this cannot be true in the long run.
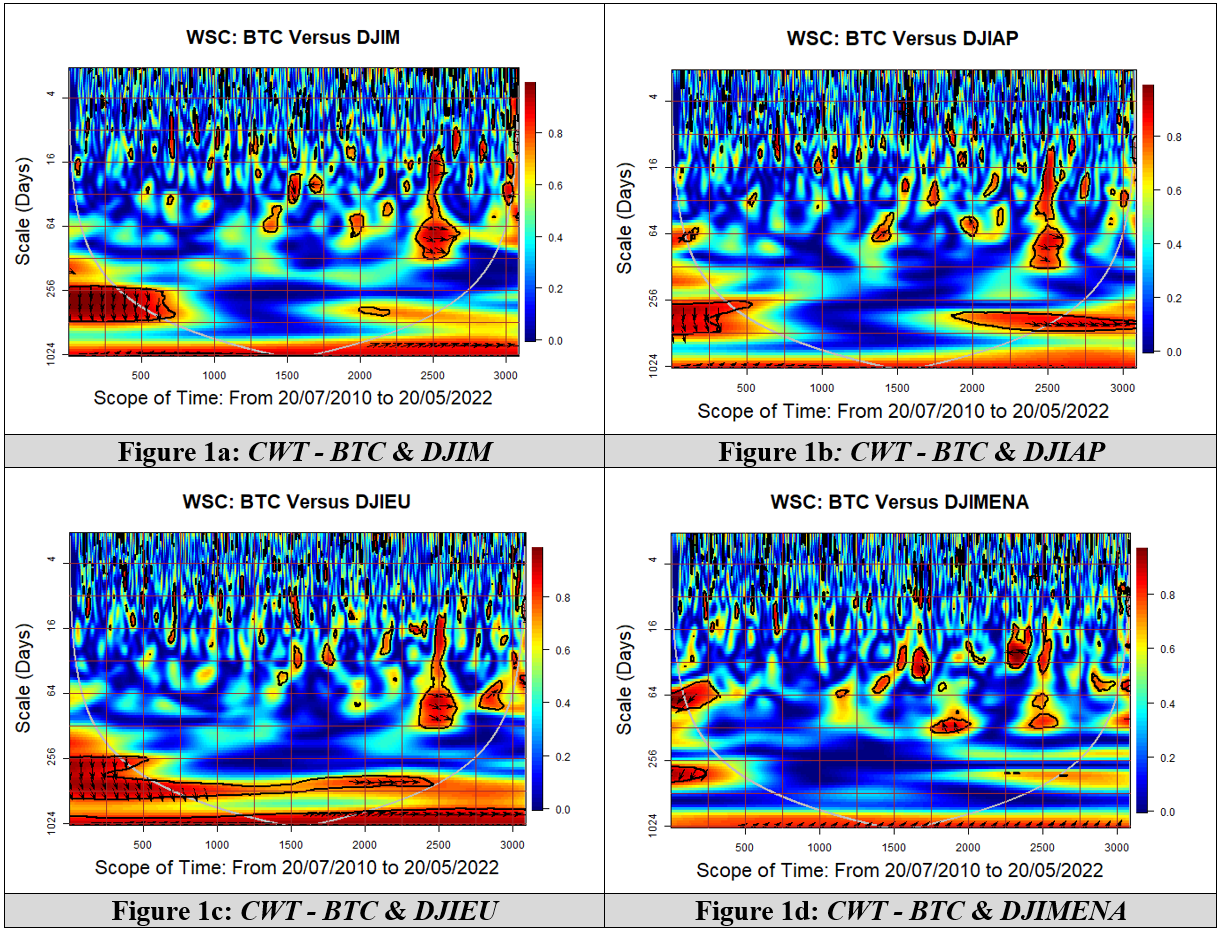
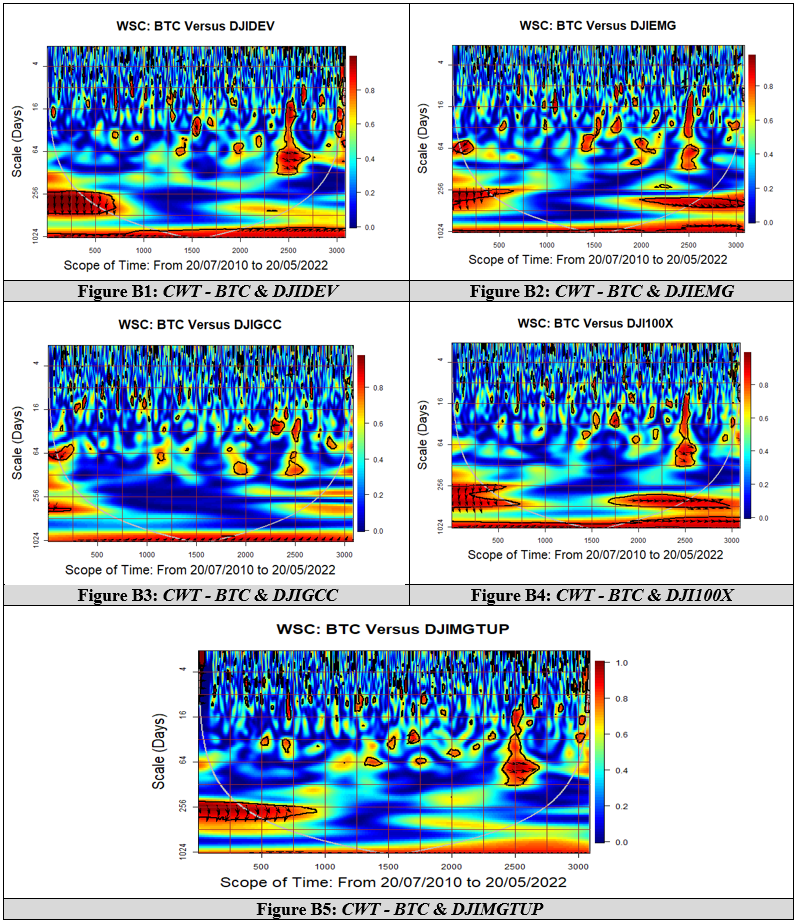
The set of Figure 1 and Figure B (in Appendix) present the continuous wavelet coherence between BTC and all Islamic markets (under study), indicating that BTC could be a good fit for portfolio diversification in the short term. Only during COVID-19 and the Russia-Ukraine war do correlations between BTC and Islamic markets become stronger, showing that all markets are affected by COVID-19. However, the most affected during the Russia-Ukraine war is the European market and, to a lesser extent, the Asia Pacific, MENA and World Emerging markets.

Our findings confirm a very high correlation (red zones) between BTC and the considered markets during the COVID-19 pandemic, during which the two markets are broadly in-phase, moving instantly almost together, with a small lead effect of BTC on the Islamic indices during the scales between 16 and 128 days.
During the Russia-Ukraine war, we observe high correlation only for European Islamic market in the short run, around the scales 64 days, means a horizon of investment around two months. Also, higher correlations are found in the case of Asia-Pacific and GCC markets around the scale of 32 days, showing co-movement between BTC and the markets during the Russia-Ukraine war for a horizon around one month. Further, the Russia-Ukraine war shock propagation has affected, first, Asia-Pacific and GCC markets and then the European Islamic market.
The two similar markets, Islamic Top 100 firms index and World Technology Emerging Markets (see Figures B2 and B5 in the Appendix) behave differently compared to the Asia-Pacific and GCC markets, evidenced by different scales and, in a non-homogeneous manner, higher correlations (represented by smaller red blocks) happening at certain times. This could be related to different information arrivals at different moments which may influence the investment objectives of short-term market participants acting on both markets.
V. Conclusion
The multi-horizon analysis, covering the COVID-19 crisis and the Russia-Ukraine war, provides evidence that some of Bitcoin’s low correlations with Islamic indices during periods before extreme events open opportunities for diversification.
Our findings reveal that: (i) Bitcoin acts as a good diversifier for all examined Islamic stock indices, with some evidence of less benefit for Islamic Top 100 firms index and World Technology Emerging Markets, (ii) Bitcoin cannot function as a safe haven for all Islamic Markets in the long term due to its poor capacity for diversification during the COVID-19 pandemic and the Russia-Ukraine war.
Our principal findings have practical policy implications for both Islamic investors and regulators, supporting the resolution to use digital currency for commercial transactions. As such, this study has filled, timely the research gap on Bitcoin’s extreme volatility post-COVID-19.
There are some limitations of our study based on wavelets since the variables could not be analyzed together and the graphs sometimes proved difficult to interpret. The study can be extended by considering futures markets and adding more currencies.

