
I. Introduction
After more than two years’ disruptions due to the COVID-19 crisis, the recent Russia-Ukraine war (Abdullah et al., 2022; Khalfaoui et al., 2022) has emerged as a double whammy for many countries, including the Asian nations. Due to the economic sanctions on Russia, oil price has shot up by 30 percent since 24 February, 2022.[1] As regards food supply by both Russia and Ukraine, 60% of the global production of sunflower and 28.9% of wheat are affected by both of these countries.[2] As expected, the whole world is facing huge problems on the supply chain management front due to the economic sanctions on Russia and for the dysfunction and tensions at the ports in Ukraine (Roubini, 2022). In Asian countries, the impact of the Russia-Ukraine war is more evident as they consume 35% of the global oil.[3] The bulk of Asian nations, including the South Asian bloc, import oil making them sensitive to oil shocks, by raising the cost of production and escalating the cost of goods for consumers which ultimately impacts the financial markets (Chowdhury et al., 2021).
Over the last two decades, alternative financial instruments, such as the Islamic finance and cryptocurrency, have witnessed tremendous growth. Both types of financial markets are unique in terms of their characteristics. Islamic finance deals with interest-free mechanisms, where no gambling or speculation is allowed (Chowdhury et al., 2020). Regarding the resilience of Islamic finance, several studies conclude that Islamic finance is more resilient than conventional finance especially during the last few crises, including the COVID-19 pandemic (Meo et al., 2021; Uddin et al., 2017). Like other financial markets, the Islamic finance industry is not exempted from getting hit by the impact of the Russia-Ukraine war (Będowska-Sójka et al., 2022). However, a few Islamic finance markets such as Saudi Arabia used their oil reserves to protect their economy and witnessed 11.08% economic growth in the last two quarters of 2022.[4] This poses an interesting question about how the Russia-Ukraine war is affecting Islamic finance markets which are predominantly from the Asian region.
On another hand, although cryptocurrencies are usually considered a safe haven during the crisis periods (Chowdhury et al., 2022), the consequences of the Russia-Ukraine war on the cryptocurrency market are still debatable. Mohamad (2022) identifies bitcoin and Brent oil as the first asset drivers and others such as silver, WTI and natural as the followers before and after the start of the invasion. Nevertheless, Umar et al. (2022) finds that the Russia-Ukraine war has negatively affected some coins while some other coins offer hedge against geopolitical risk.
With this brief background discussion, this study makes an initial attempt to investigate the risk spillover of the Russia-Ukraine war and oil price on Asian Islamic Stocks and cryptocurrency using the Quantile connectedness approach. The results of the study indicate that the risk spillovers of the Russia-Ukraine war appear to increase in the extreme lower and upper quantiles. This study contributes to the literature in two ways: Firstly, this is one of the first attempts to investigate the impact of the Russia-Ukraine war on both the Islamic finance sector and Bitcoins. Secondly, this study considers the impact of the Russia-Ukraine conflict on Asian financial markets solely. Although some studies have used samples containing some Asian countries (Będowska-Sójka et al., 2022; Boungou & Yatié, 2022; Mohamad, 2022; Umar et al., 2022), no comprehensive studies appear to have been done so far with a large sample using the quantile connectedness approach.
II. Data and Methodology
A. Data
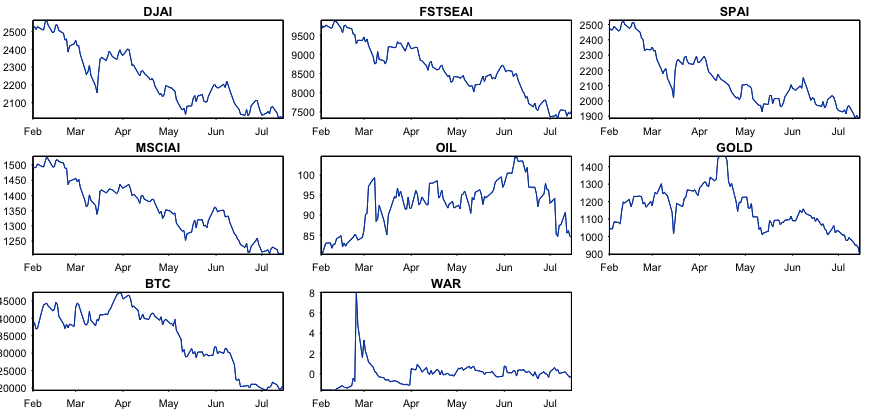
We select Dow Jones Islamic Market Asia/Pacific Index (DJAI), FTSE SGX Asia Shariah 100 Index (FSTSEAI), S&P Pan Asia Shariah (SPAI), and Morgan Stanley Capital International (MSCI) All Country Asia Pacific excluding Japan Islamic Index (MSCIAI) as proxy of Asian Islamic stocks. We select Bitcoin (BTC) as the alternative diversification asset alongside Crude Oil Brent Spot Asia (OIL) and COMEX Gold Future Asia Spot Price (GOLD). To proxy the shock of the Russia-Ukraine war panic (WAR), following Boungou and Yatié (2022) and Khalfaoui et al. (2022), we construct a variable with Google trend and Wikipedia trend[5] using principal component analysis (PCA). The tensions between Russia and Ukraine increased during February 2022 and eventually Russia invaded Ukraine on 24th February, 2022 (Będowska-Sójka et al., 2022; Boungou & Yatié, 2022). Therefore, 1st February 2022 to 15th July 2022 is selected as our sample period and all assets’ closing prices collected from DataStream. Following this, we construct a WAR variable using PCA, we collect “Russia-Ukraine War” keyword Google trend[6] and “Russo-Ukrainian War” Wikipedia page statistics.[7] Figure 1 illustrates the historical series of the variables. The figure shows an upsurge in the price of GOLD and OIL, while other asset prices gradually go downward. Moreover, the WAR series shows a higher level of panic and anxiety immediately after the invasion.

B. Methods
We apply the quantile connectedness approach proposed by Chatziantoniou et al. (2021) to examine the quantile risk spillover mechanism of the Russia-Ukraine war and oil price on Asian Islamic Stocks and Bitcoin. We first estimate a quantile vector autoregression to measure connectedness metrics as follows:
yt=μ(τ)+p∑j=1Φj(τ)yt−j+ut(τ)
and are dimensional first differenced variables vectors, τ is between [0.05 to 0.95] and represents the quantile of the variables, the lag length of the QVAR model is represented by is a dimensional conditional mean vector, is a dimensional QVAR coefficient matrix, and demonstrates the dimensional error vector which has a dimensional variance–covariance matrix, Wold’s theorem is used to transform to its representation:
To show the shock effect of variable on variable the H-step forward Generalized Forecast Error Variance Decomposition (GFEVD) of it is calculated as:
ψgij(H)=∑(((τ)−1ij∑H−1h=0(e′iψh(τ)∑(((τ)ej)2∑H−1h=0(e′iψh(τ)∑(((τ)ψh(τ)′ej),
˜ψgij(H)=ψgij(H)∑kj=1ϕgij(H)
III. Results
A. Summary statistics
The level series of closing price and WAR variable are non-stationery using Augmented Dickey–Fuller (ADF) and Phillips–Perron (PP) unit root tests. Therefore, we calculate the first difference using The summary statistics, unit root tests, and correlation analysis of differenced series are presented in Table 1. Table 1 shows that the standard deviation of all variables is very high. Therefore, returns on all assets are highly volatile during the Russia-Ukraine war. Skewness shows MSCIAI, OIL, and GOLD are negatively skewed, whereas other variables are positively skewed. The ADF and PP unit root tests confirm the stationarity of the variables. The correlation analysis shows a significant negative correlation between WAR and all asset returns excepting GOLD.
B. Averaged quantile connectedness
First, we calculate the averaged connectedness over the mid and extreme quantiles (τ =0.05, 0.50, 0.95). The results of averaged quantile connectedness of mid and extreme quantiles are presented in Table 2. More specifically, Table 2 presents the mid quantile (τ=0.50) connectedness values and upper and lower quantile (τ =0.05 and τ =0.95) connectedness values in parentheses. For example, results show that the SPAI has the most significant own variance share spillovers at 69.73% in the mid quantile, whereas in the extreme lower BTC (16.26%) and in the extreme upper quantile WAR (19.22%) have the most considerable own variance share spillovers. This result implies that in the upper quantile, WAR forecasting error variance is accounted for by all others at 80.78%. Overall, results show WAR is influenced 132.10% of the assets in the network and affects the market system by 80.78% in the upper quantile, indicating that WAR is a net transmitter of shocks (51.32).
Moreover, in the mid quantile, WAR is a major risk transmitter of shocks (23.46%), whereas major receiver in the lower quantile (-21.87%). The heterogeneous appearance of WAR as a net risk receiver and/or transmitter denotes that over lower/extreme events, WAR receives shocks, and during higher extreme events, WAR transmits shocks (Boungou & Yatié, 2022; Meo et al., 2021; Mohamad, 2022; Umar et al., 2022). Furthermore, results uncover that BTC plays the role of a major net risk receiver in the mid-quantile (-21.87%). The existence of BTC as a central net shock receiver in the overall system is not surprising, as investors seek alternative investments and payment channels through BTC (Mohamad, 2022; Umar et al., 2022). Finally, we can see from the average total connectedness index (TCI) that the TCI is higher over the extreme quantiles (lower=86% and upper=87.15%) and lower for mid quantiles (57.47%).
Since this analysis only shows average connectedness measurements over the mid and extreme quantiles, which may obscure time-specific, time-varying and other quantile impacts, we move on to the dynamic connectedness plots.
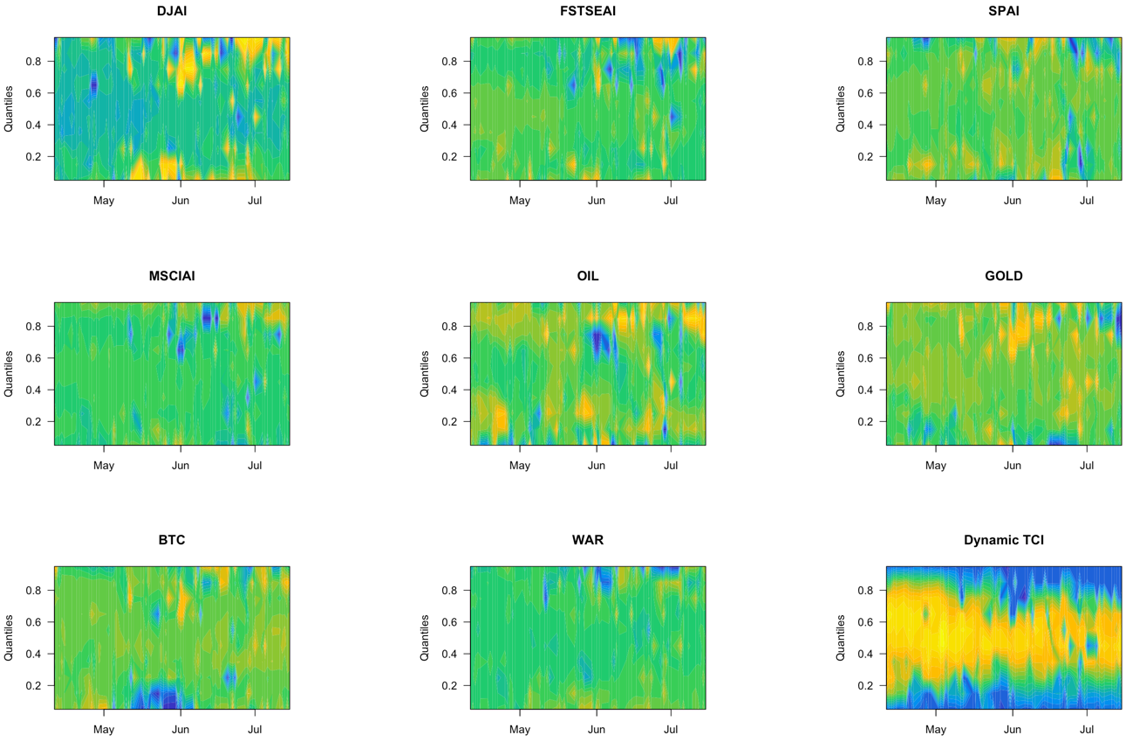
C. Dynamic quantile connectedness
The dynamic net directional connectedness and dynamic TCI results over the quantiles are plotted in Figure 2. The Dynamic TCI results show that before the Russia-Ukraine invasion on 24th March, TCI was low. However, after the invasion, TCI is higher in extreme quantiles. However, TCI is lower across the mid-quantiles. As a result, extreme lower and upper quantile dynamics must be analyzed separately, as analyzing the full TCI would hide the source of the movements.
According to the dynamic analysis, overall TCI growth is primarily driven by extreme lower and upper quantiles rather than mid quantiles. Moreover, net directional shock transmission mechanism of individual variables shows WAR as a net risk transmitter from mid to upper quantile and as a net risk receiver in a few lower quantiles. However, Islamic stocks and BTC show risk revivers in the upper and lower quantiles. Overall, results suggest a heterogenous risk spillover effect of WAR on the Asian Islamic Stocks, BTC, OIL, and GOLD (Boungou & Yatié, 2022; Mohamad, 2022; Umar et al., 2022).

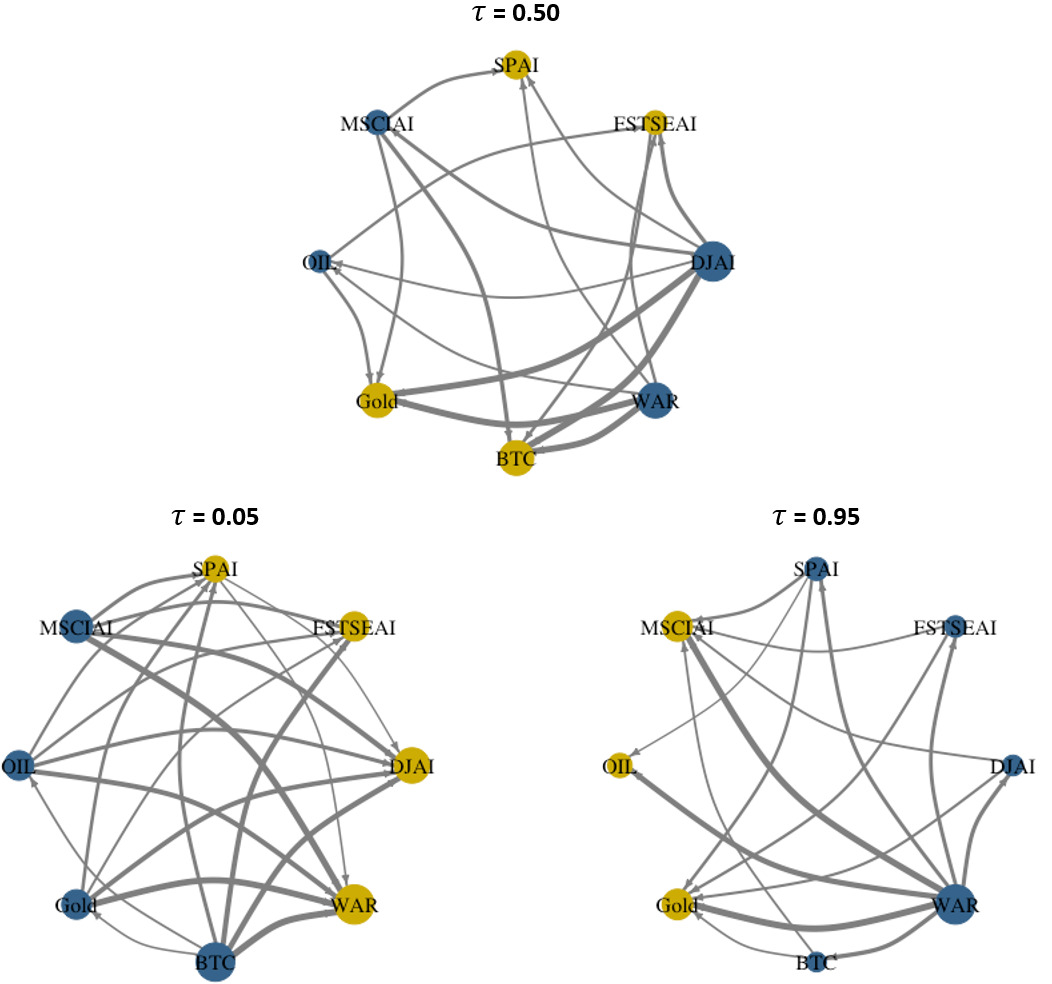
D. Quantile network connectedness
Finally, we analyze the quantile connectedness network plots over mid and extreme quantiles. Results are illustrated in Figure 3, where the blue hue represents the net transmitter, and the yellow hue represents the net receiver of the shocks to the system. The results demonstrate a more comprehensive transmission mechanism across all sample variables over the conditional distribution. In the mid quantile (τ = 0.50), WAR is a major risk transmitter, which transmits risk towards FSTSEA, SPAI, BTC, and GOLD, whereas OIL transmits risk to GOLD and FSTSEA. In contrast*, in the lower quantile (τ = 0.05), WAR is the major risk receiver, which receives risk from MSCIAI, SPAI, BTC, OIL, and GOLD, whereas BTC transmits risk to the network system. *Finally, the upper quantile (τ = 0.95) shows* WAR* is major risk transmitter, which transmits risk towards FSTSEA, SPAI, DJAI, and BTC, whereas most of the shock is received by OIL and GOLD. Therefore, investors behave irrationally, and this can potentially have a long-term effect on returns (de Long et al., 1990). These heterogenous spillover mechanisms would offer diversification opportunities for Asian Islamic stock through BTC, OIL, and GOLD (Boungou & Yatié, 2022; Mohamad, 2022; Umar et al., 2022).
IV. Conclusions
This paper makes an initial attempt to investigate the risk spillover of the Russia-Ukraine war and oil price on Asian Islamic Stocks and Bitcoin using a quantile-based connectedness approach. The major findings provide indications of variance in the quantile structure of the connectivity system among oil price, Asian Islamic Stocks and Bitcoin. The Russia-Ukraine war panic shocks appear to propagate more effectively at the extreme conditional tails than at the conditional mean or median. The economic rationale behind this result can be explained by investor herding behavior (de Long et al., 1990), implying that negative mood promotes loss aversion and herding tendency in noise traders as well as irrational investor behavior. Policymakers are, therefore, advised to understand the patterns of return spillovers, especially during extreme market conditions, and subsequently intervene by establishing policies and tactics that would enable the smooth recovery of markets following difficult positive or negative market situations.
Wikipedia Trends and Google Trends are regarded as a statistic for expressing popular interest on a certain issue. Anxiety (stress) or intensity can be shown through intense interest. As a result, it enables the analysis of stock market responses (see Boungou & Yatié, 2022; Khalfaoui et al., 2022).
Source: https://trends.google.com/trends/explore?q=Russia-Ukraine War