I. Introduction and Literature Review
Cryptocurrencies, the most recent of innovations in finance, have attracted a great deal of attention from retail and institutional investors, Big Tech companies, media, regulators, and policy makers in the last few years. In the wake of the recent COVID-19 crisis, it has become a popular choice for portfolio managers and investors who are in search of new investment opportunities that offer higher hedging effectiveness for their diversified portfolios. For instance, a basket of cryptocurrencies is found to offer no safe-haven opportunities from the perspective of international equity indices during the pandemic besides Tether which appears to offer some hedging effect (Colon et al., 2020; Goodell & Goutte, 2020). In the meantime, a study by Disli et al. (2021) found that oil, gold, and Bitcoin did not hedge against stock indices during the pandemic outbreak. However, they can provide diversification opportunities with gold, oil, and Bitcoin at longer horizons.
Islamic financial markets have been previously considered a safe-haven asset class since they were decoupled from traditional financial markets during past crises. For instance, Ho et al. (2014) prove Islamic equity indices to be resilient and to outperform their conventional counterparts during the global financial crisis (GFC), while in non-crisis periods, the results are found to be inconclusive. More recently, a study by Al-Yahyaee et al. (2020) show that Islamic indices performed better in the post-crisis period while conventional indices usually outperformed them during the pre-crisis period. Consequently, the literature review on Islamic stock indices’ performance against their conventional counterparts folds in two ways: studies suggesting the outperformance of Islamic indices during times of financial uncertainties like the GFC or the European debt crisis (Ashraf & Mohammad, 2014; Tahir & Ibrahim, 2020) and other studies which confirm the neutrality of Islamic indices against conventional markets or sometimes suffer even higher volatility (Al-Khazali et al., 2014; Paltrinieri et al., 2019; Sensoy & Tabak, 2016).
Nevertheless, the COVID-19 pandemic and social isolation negatively affected both Islamic and conventional markets (Abdullah et al., 2021; Bugan et al., 2021; Hung & Vo, 2021; Sherif, 2020; Yarovaya et al., 2021). However, recent studies consider Islamic equity markets attractive diversification markets against US and European markets (Ashraf et al., 2020; Hasan et al., 2021; Umar & Gubareva, 2021). Thus, traditional portfolio investors and managers need to adjust their portfolio allocation by adding other Sharia-compliant safe-haven assets and portfolio diversifiers.
Other studies have investigated the causal relationship between Islamic equity markets and cryptocurrencies. Mensi et al. (2020) investigate the causal relationships between Bitcoin and the regional Islamic equity indices and find that Bitcoin affects regional Islamic equity markets including Asia Pacific and Japan. Their results suggest that the diversification effect is found to be smaller for longer-term investors (on month-based investment horizon) compared to short-term investors (on day-based investment horizon).
Nevertheless, the topic of cryptocurrencies, from a shari’ah perspective, still has not yielded a clear and firm consensus. Abu-bakar (2018) explores different shari’ah opinions related to the permissibility of cryptocurrencies using a doctrinal method. His results reveal three main categories: a) while cryptocurrencies lack many safeguards (e.g., regulation and policy), it is deemed preferable not to reject it altogether while working on establishing proper regulations for its use. b) Cryptocurrencies lack the basic elements that qualify their being considered as “money” from a shari’ah perspective (e.g., unit of measurement) making it rejectable from a shari’ah perspective. c) An observing category with a neutral opinion advocating keeping an eye on the technology without explicitly rejecting it. They can potentially be used as a parallel currency (with fiat) and as a hedging tool to protect wealth and investment (Choudhury, 2018). Despite these conflicting opinions, several shari’ah-compliant cryptocurrencies have emerged over the past 5 years like OneGram, backed by Gold in the UAE, NoorCoin, in Indonesia and the Stellar, in the USA (Aliyu et al., 2020).
Theoretically, in modern portfolio theories, the investors aim to diversify their assets in a financial portfolio to maximize the portfolio and its returns (Marowitz, 1952). The cryptocurrency market offers important opportunities for investors to diversify their portfolio and have profitable speculations (Corbet et al., 2018). However, the recent uncertainty in cryptocurrency markets has fueled panic in this asset class and questions about the safe-hedger status of this market. Interestingly, a study by Bouri et al. (2017) finds that Bitcoin offers a diversification way out in Asian stock markets only in times of extreme downsides. Furthermore, the diversification effect varies across different time horizons. These findings pave the way for the idea that the current extreme uncertainty in cryptocurrency markets might push traditional investors to seek a safe haven in Islamic equity markets. This is likely, given that modern portfolio theories combine several portfolio assets with a varying degree of high risk or low correlation to decrease the total level of total risk that would match the investor’s appetite.
Although studying hedging opportunities in Islamic equities for a cryptocurrency portfolio might look arduous at the outset. Nevertheless, established findings from previous studies (Abdulkarim et al., 2020; Akinlaso et al., 2022; Delle Foglie & Panetta, 2020; Hassan et al., 2021) present a reasonable basis for this research. More so, the increasing volatility in the cryptocurrency market and the search for a new haven justify the need to explore Islamic equity markets. Although some empirical literature focus on whether cryptocurrency markets offers diversification opportunity for Islamic equity markets (Ali et al., 2022; Bahloul et al., 2022; Disli et al., 2021), this study is, to the best of our knowledge, the first to examine how uncertain times might cause cryptocurrency market investors shift to Islamic equity markets as a safe haven. Interestingly, Colon et al. (2020) find that cryptocurrency markets exert an upside risk pressure for equity investors portfolios motivating an exploration of whether equity markets, and precisely Islamic equity markets, could offer hedging for cryptocurrency market investors. This is especially essential for retail investors who are more likely to fall victim to biases and make less “rational” decisions due to lack of knowledge and information. This is as a consequence of retail investors usually having a limited understanding of financial markets and their tendency to be more curious and reactionary than professional institutional investors (Black, 1992).
We contribute to the literature by providing novel results important for cryptocurrency and traditional investors by aiming to answer the question: Are Islamic equity markets in Asia able to diversify the risk of cryptocurrency markets during times of increased uncertainty?
II. Data and Methodology
A. Data
Table 1 shows the variables used in the study. We have taken daily data of all the variables from May 01, 2017 to May 25, 2022. Time period of this study is restricted due to the nonavailability of some cryptocurrencies for a longer period. However, we still have 1323 observations which would sufficiently capture the time-varying correlation dynamics of market returns. The full data set is taken from the Refinitiv DataStream. Islamic equity index returns and cryptocurrency asset returns are calculated as differences of the logarithmic daily closing prices of indices as shown in the equation below,
rt(i)=LogPtPt−1
Where is an index value. The conversion is necessary to get stationarity in variance.
The sample selection is based on our assessment of the state of cryptocurrencies in Malaysia, Indonesia, India, Thailand, and Singapore. Besides the fact that Malaysia and Indonesia are amongst the fastest growing countries in the Islamic finance industry, including Islamic equity markets as reported by Standard & Poor (S&P) Islamic Finance Outlook 2022, cryptocurrencies are increasingly regulated in these countries (for instance, Malaysia’s Securities Commission regulated cryptos in 2019 and recognizes it as a security while Indonesia is treating it as a commodity trade item). Accordingly, we ought to investigate how safe Islamic equity markets are against cryptocurrency markets in Asian countries.
B. Methodology
In this study, we adopt the Continuous Wavelet Transform (CWT) model of the wavelet method to investigate the potential diversification benefits in Asian Islamic Equities for cryptocurrency portfolios in times of high uncertainty, such as the COVID-19 pandemic. For a deep dive, we apply the Continuous Wavelet Transform (CWT) model of the wavelet method to evaluate how causality and correlation among these assets vary at different stock holding periods in times of high uncertainty.
This method is more effective and efficient for discerning portfolio diversification benefits on multiple investment horizons when compared to other popular (cointegration test, Generalised Vector Autoregressive – VAR, Vector Error Correction –VEC, and Exponential General Autoregressive Conditional Heteroskedastic – EGARCH) models that seem to offer poor fitness of the model (Sadorsky, 2012). Most studies that have applied these models to examine the correlation between financial assets to discern diversification benefits focus on the time dimension of index returns, ignoring the importance of frequency-varying properties of their co-movements (Tiwari et al., 2016).
The CWT model appropriately combines time-domain and frequency-domain properties in its correlation analysis. More so, the CWT does not require strong assumptions regarding the data-generating process for the series, hence its findings offering greater insights into comprehending the volatilities between assets. Employing such a method in this study empowers investors of both cryptocurrency assets and Islamic stock markets who typically have different priorities about time scales and investment horizons for their financial assets. They are better able to understand the correlation over time and across investment horizons between both asset classes and to explore diversification benefits that may exist in their investment portfolio in both time and frequency domains.
Practically, applying CWT requires a set of restricted waveforms commonly referred to as mother (Ψ) and father wavelets (φ). The mother wavelet is used for interrogating signals in greater detail and is relevant for higher frequency testing. While the mother wavelet integrates to zero, its harmonizing normalized counterpart, the father wavelet, integrates to 1. The CWT is obtained by projecting a mother wavelet (Ψ) onto an examined time series x(t) ∈ l2(R) (see Najeeb, Bacha & Masih (2015), that is:
Wx(u,s)=∫∞−∞x(t)1√sψ((t−us)dt
Here, refers to the time domain and refers to its position in the frequency domain. Therefore, the wavelet transforms, by mapping an original time series into a function of and to provide information on both time and frequency simultaneously. To discern the nature of the interaction between two-time series (that is, how closely the cryptocurrency asset (X) and Islamic equities (Y) are interrelated by linear transformation), we apply a bivariate framework called wavelet coherence. The wavelet coherence is an improvement over Fourier transforms (which deals with frequencies alone) through the capture of the degree of co-movement between two series across time and frequencies (In & Kim, 2013; Madaleno & Pinho, 2010). Mathematically, this framework is defined as follows:
R2n(s)=IS(s−1Wxyn(s))I2S(s−1IWxn(s))I2⋅S(s−1IWyn(s))I2
While is a smoothing operator, is a wavelet scale, is the continuous transform of our cryptocurrency asset series (X), is the continuous wavelet transform of our Islamic equities series (Y). Consequently, is the cross wavelet transform of both the cryptocurrency asset (X) and Islamic equities (Y). assumes a value that ranges from 0 to 1, where 0 indicates no co-movement and 1 indicates perfect strong co-movement.
III. Results and Discussion
In this section, we report the statistical results and analysis of the test findings. After removing the outliers and ensuring data normality, we start by statistically describing both cryptocurrency and Islamic equity series based on mean, standard deviation and pairwise correlation. As shown in Table 1, Ethereum records the highest historical returns (0.25) on average (slightly edging Bitcoin by 10 basis points), while Bitcoin is historically the least volatile (standard deviation of 0.047) of the three cryptocurrencies under study. In a similar fashion, India’s Islamic equity has the highest historical returns (0.03) on average while Indonesia’s Islamic equity presents as the most volatile (standard deviation of 0.016) in Asia’s Islamic equities market.
We also observe a large dispersion and a generally positive but significantly low correlation (Table 2) between cryptocurrency assets and the Asia Islamic equities under study. While the low correlation may suggest potential diversification benefits between the two markets of interest, it will be misleading to rely on descriptive statistics for investment and portfolio management strategies. Lastly, the total number of observations is 1323 assets and equities trading days, representing five years and four months of active transaction data.
A. Time-Frequency Analysis using Continuous Wavelet Transform (CWT)
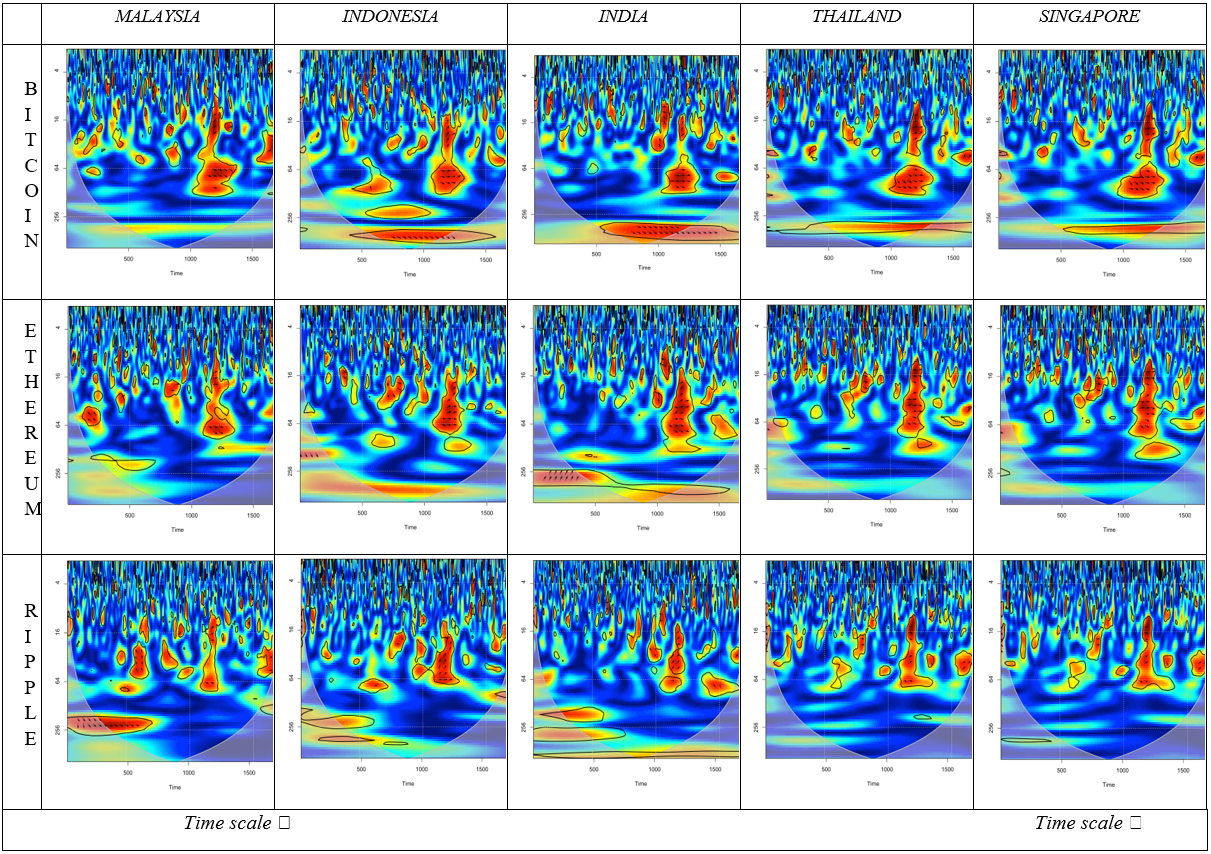
Figure 1 presents the results of the Continuous Wavelet Transform (CWT) estimation which discerns the interaction between our focus cryptocurrency assets and Islamic equities across time and frequency domains. Accordingly, the CTW output is plotted between two axes simultaneously. For interpretation, the time component is plotted on the horizontal axis, which represents the number of trading days (as in, 64 to 256 trading days timeline), while the frequency component is plotted against the vertical axis, which indicates the scale, frequency, or investment horizons from short- to long-term span (such as 4 to 16, 16 to 32, 32 to 64). Additionally, the silhouettes with black border lines indicate the statistical significance at a 5% significance level (determined by using Monte Carlo methods) at any point in time and frequency.
Furthermore, the level of coherence is indicated by a color code for power that ranges from blue (low coherence) to red (high coherence). This is followed by observable vectors pointing in various directions. When vectors point in the right direction, it suggests that cryptocurrency assets and Islamic equities under study are in-phase, and otherwise when vectors point towards the left direction. There are a few key considerations when both series are not in phase (opposite) in a CWT plot. These considerations matter for discerning the lead/lag relationship that exists between our series during co-movement. For instance, when the arrow points upward and tilts towards the right, cryptocurrency assets lead at that point in time and on the investment horizon. Cryptocurrency assets would lag when the vector arrows point downward and tilt to the right. Interchangeably, when the vector arrows point upward and tilt to the left, Islamic equity leads, and it lags when they point downward and to the left, at that point in time and investment horizon.
As seen in Table 3, the interconnectedness between cryptocurrency assets and Islamic equities under study varies in time and across investment horizons. Broadly, the CWT plots suggest a general low coherence between the two asset classes, which establishes the likelihood of favourable diversification benefits for cryptocurrency investors in Asia Islamic equities. This is observable by the dominance of the colour blue (see power spectrum) that covers a large proportion of the cones. However, on other time scales and investment horizons, the power spectrum turns red with vector arrows that suggest stronger co-movement with the 5% statistical significance levels.
While the Asia Islamic equities present relatively higher diversification benefits for the Ripple cryptocurrency asset, Bitcoin and Ethereum cryptocurrencies also enjoy significant diversification benefits on shorter investment horizons (at the scale of 4 to 16 days) compared to the medium-term holding period (at the scale of 64 to 90 days). This implies that the investment favours cryptocurrency speculators who choose to invest in short holding periods.
On the mid-term investment horizon, the co-movement becomes stronger and the lead-lag relationship between both asset classes becomes more apparent. For instance, the vector arrows in most of the CWT plots point upward and tilt to the right suggesting that the cryptocurrency asset class is leading the Islamic equity asset class. This implies potential for contagion and a lower diversification opportunity for cryptocurrency portfolios. Also, longer-term holding periods (256 days) seem to be most promising for diversification opportunities across both asset classes. The lead/lag relationship tends to change with Islamic equities leading in most cases, although scantly.
Above all, the CWT results suggest that Asia Islamic equities offer portfolio diversification opportunities both in the short-term (4 to 16 days) and the long-term (64 to 256 days) investment holding periods. These results hold significant strategic implications for crypto-investors, portfolio managers, hedge fund managers, institutional investors and policymakers for capital budgeting and investment decisions on portfolio diversification. These findings are also in line with previous studies (Ali et al., 2022; Bahloul et al., 2022; Bouri et al., 2017; Disli et al., 2021) that suggest that the correlations between cryptocurrency (Bitcoin) and equities tend to vary depending on the investment holding periods.

IV. Conclusion
This paper addresses a considerable void in the literature by assessing whether Islamic equities offer portfolio diversification benefits to cryptocurrency investors in the short and long term. We employ the Continuous Wavelet Transform (CWT) model to examine the nature of coherence between major cryptocurrency asset classes and major Islamic equities markets in Asia on different investment horizon periods and timelines.
In summary, our findings indicate that the Asia Islamic equities market offers diversification opportunities for cryptocurrency asset portfolios. This suggests that investors who are already exposed to the cryptocurrency asset class can get more diversification benefits by including major Islamic equities in Asia in their portfolios. Although this opportunity is relatively weak in the medium-term (16 to 64 days), cryptocurrency investors can gain more profits through short-term transactions if they diversify their portfolios with the Islamic equity asset class. These findings may also imply that Islamic equities in Asia markets are not efficient and are prone to short-run speculative activities.
Nevertheless, different stakeholders such as fund managers, investors, and policymakers can potentially apply our findings to investment and policy-making decisions. Additionally, policymakers can use this information to make an early warning system of financial risks. Potential avenues for relevant future research include focusing on individual components of the broader stock markets using firm-level data to show more comprehensive results. For example, one could consider time and frequency connectedness and portfolio diversification between cryptocurrencies and the stock markets of some famous energy or telecommunication firms.