I. Introduction
Human civilizations, in recent decades, are more exposed to the frequent and severe impact of global warming and climate change. Many countries are trying to be compliant with globally agreed upon sustainable environment norms and are trying to reduce the level of CO2 emissions. Countries, in their individual capacities, are observed to adopt measures that promote green lifestyles. Advocates of ecofeminism argue the disproportionate effect of climate change on women, claiming that women’s historic roles in gathering firewood, collecting water, and managing agriculture reflect women’s greater motivations to conserve resources and decrease CO2 emissions on account women’s biologically regenerative powers (Mies, 2014). Women are more diligent in environmental reform projects and recognize environmental risks as more dangerous (Ergas & York, 2012). However, the empirical conclusions are mixed (Doss et al., 2018; Meinzen-Dick et al., 2014). Studies indicated that average CO2 emissions from men and women are distinctive (Carlsson-Kanyama et al., 1999; Cohen, 2014; McKinney & Fulkerson, 2015; Räty & Carlsson-Kanyama, 2010). There are debatable analytic questions about the links between gender disparities and the global political economy of extractive production and consumption. Women in developing countries face distinguishing hazards associated with climate-induced resource scarcity. Ecofeminism argues that the status of women is a cause and an effect of environmental conditions. Nations with higher female representation in governing bodies have lower climate footprints. Gender equality and improving the status of women are key to halting climate change (McKinney & Fulkerson, 2015). We must understand gendered vulnerability to climate change within socioeconomic and cultural backgrounds. Gender inequality is a socioeconomic construct. Gender inequality has distinctive characteristics, making it distinct from the other forms of inequality (Koengkan & Fuinhas, 2021). Transition to clean energy sources has health benefits for women (Maji et al., 2021), indicating why women are more likely to be environmentally-friendly. Political empowerment, measured by the percentage of positions in Parliament held by women, is negatively correlated with reducing CO2 emissions (Ergas & York, 2012; McKinney & Fulkerson, 2015). Female employment is found to reduce CO2 emission (Wang et al., 2021). To the best of our knowledge, the only study that has directly assessed the effects of gender inequality on CO2 emission is Koengkan & Fuinhas (2021). The gender wage gap, used as the indicator of gender inequality, showed an increase in CO2 emissions for 14 EU countries between 1991 and 2016. As the authors recognized, existing research does not offer sufficient treatment of the connection between the gender inequality problem and the upsurge in environmental degradation. This paper attempts to unravel the connection among gender empowerment, income inequality and environmental sustainability for emerging market economies. The following section provides an outline of the data and methods used for this study.
II. Analytical Framework
A. Data
This paper emphasizes the effects of gender parity index (GPI) on CO2 emissions for a panel of 6 emerging market economies, namely Colombia, Indonesia, Vietnam, Egypt, Turkey, and South Africa.[1] CO2 emissions per capita is used as a dependent variable (measured in metric tons per capita). The independent variables are Gender Parity Index (gross enrollment ratio of girls to boys in primary education), energy use per capita (measured by kg of oil), real gross domestic product per capita (GDP based on 2010 US$) and Gini coefficient (income inequality). The data on CO2 emissions per capita, energy consumption per capita, GDP per capita and Gender Parity Index are extracted from the World Development Indicators (World Bank, 2021). Further, Gini coefficient, a measure of inequality has been extracted from the Standardized World Income Inequality Database (Solt, 2009) over the period of 1990-2019.
B. Empirical modeling
The relationship between gender equality and carbon emissions has been explored considering the vital role of energy, economic growth and income inequality in carbon emissions framework for six emerging market economies which can be written as:
CO2=f(EC,GDP,GINI,GPI)
where CO2 shows that carbon emission per capita, EC, refers to energy consumption per capita, real GDP refers to real Gross Domestic Product per capita, LGINI refers to income inequality and GPI refers to Gender Parity Index.
CO2it=ϕ0+δ1ECit+δ2GDPit+δ3GINIit+δ4GPIit+ξit
This study also examines whether the relationship between economic growth and carbon emissions is U-shaped or an inverted U shape. We therefore include a squared term of real GDP per capita into carbon emissions function.
CO2it=ϕ0+δ1ECit+δ2GDPit+δ3GDP2it+δ4GINIit+δ5GPIit+δ6(GINIit∗GPIit)+ξit
The energy (EC) sensitive carbon emissions coefficient is expected to be positive if total energy demand degrades environmental quality. The relationship between economic growth and carbon emissions is inverted U-shaped if and The inverted U-shaped association indicates the presence of Environment Kuznets hypothesis. The level of income inequality impedes environmental quality, so the coefficient is expected to be positive The relationship between women’s empowerment and carbon emissions is negative if Gender equality enhances environmental quality through improvement in education and freedom to independent decision making. The interaction term shows the joint effect of both income inequality and gender equality on carbon dioxide emissions.
III. Results and Discussion
The first step before moving further into the analysis is to understand the properties of the data. Panel unit root tests are used to check whether the variables are stationary in nature. The conventional unit root test of Im et al. (2003) shows that all the variables are non-stationary at levels but become stationary at their first differences (Table 1). In the presence of cross-sectional dependence, conventional unit root tests are ineffective due to lower power. Therefore, the second-generation unit root test, Cross-sectional Im, Pesaran, and Shin (CIPS) Test (Pesaran, 2007), is also reported in Table 1 to identify the order of integration of the variables. The results obtained from the CIPS test are consistent with the first-generation unit root test. In the case of the results are found to be insignificant with trend but significant without trend. Moreover, variable rejected the cross-section dependency. So, overall, we can say that all the variables are in order 1 i.e., I(1). Indeed, we use both first generation and second generation cointegration tests reported in Table 2 to denote the long-run association between the series. Pedroni (2004), Kao (1999) and Westerlund (2006) cointegration test suggests the presence of long run co-movement among the variables.
In Table 3, the panel long run results of hypothesized relationship of gender empowerment and other variables with carbon emission have been summarized for the six emerging market economies. The results explain a negative and significant impact of GPI on CO2 emission in the case of emerging market economies. The elasticity coefficients of women’s empowerment to CO2 emission are found to be -0.643 to -2.064, indicating that a 1% increase in girls’ enrolment ratio in primary education leads to more than 2% fall in environmental damage. This suggests that women’s empowerment enhances environmental sustainability in the long run through education.
The interaction term GINI*GPI shows the joint effect of both GINI and GPI on carbon emissions. The coefficients for interaction term are positive and significant. Furthermore, the coefficients of GINI become negative and significant with the interaction term. This indicates that reducing income inequality will not be beneficial to the natural environment if the potential level of women’s empowerment is not maintained in the economy. The environment policy, if designed to merely reduce inequality, will not be fruitful without instituting a system that facilitates educating women in the term. Moreover, the positive interaction term further indicates that rising GPI will not become effective for environmental management where there are higher levels of inequality. So, inequality should be kept to the barest minimum for better environmental policy-making through women’s empowerment.
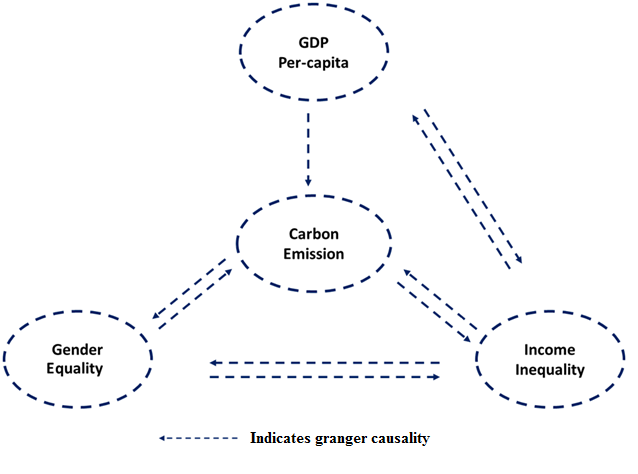
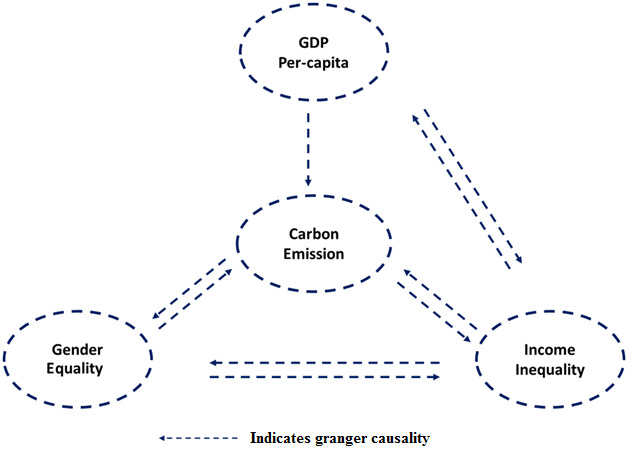
Figure 1 indicates the results of bootstrap Dumitrescu-Hurlin Granger causality tests. The results show a bidirectional causality running between CO2 emission and gender equality. It follows that when women are educated, they contribute towards the protection of the natural environment. Similarly, poor environmental conditions reduce gender parity. The results also indicate that there is a unidirectional causality running from economic growth to CO2 emissions. Moreover, a bidirectional causality is found between income inequality and CO2 emission. The results could not establish a short-term causal relationship between gender equality and economic growth in the case of six emerging market economies.
IV. Conclusions and Policy Implications
This paper explores the role of gender parity on environmental sustainability in six emerging market economies. It is found that economic growth causing carbon emission (Sahoo et al., 2022) but women’s empowerment reduces environmental damages. Policy initiatives encouraging the participation of women in economic, social, political and cultural circles lead to the betterment of the society in the long term and strengthen women’s empowerment. As a step towards a sustainable global environment, promoting educational facilities and enhancing educational infrastructure, while highlighting inclusiveness, will encourage women to pursue education. It is also worth noting that environmental policy will not be fruitful by simply reducing income inequality rather than enhancing women’s empowerment in the long term. Policymakers may focus on gender parity as a policy goal while targeting sustainable environment in emerging market economies.
The six emerging market countries possess a much younger (under 30) population than the other emerging countries. This young age group population has great potential to achieve sustainable development. As women are much close to nature than men, so does women’s empowerment have a crucial role in maintaining environmental quality in emerging countries. These emerging countries face challenges like maintaining fast economic growth rate and low environmental emissions in both short and long term. These challenges can be fulfilled with the help of greater women’s empowerment, because women are more responsible for indoor air pollutions. Gender plays important role maintaining air quality through educating women (UN Women, 2018).