
I. Introduction
The Covid-19 pandemic has inflicted enormous devastation on the global economy over the last two years. From paralysing industries and stalling trade to halting human mobility and displacing populations, the pandemic has undoubtedly caused severe commercial and social disruptions. Organisations have had to adapt to the pandemic, with many implementing remote work, flexible work arrangements, virtual meetings and social distancing measures to slow the spread of the virus, while continuing their operations and serving their customers and clients.
Currently, experts warn that the pandemic may have permanently changed people’s perception of work, hence, the economic relationship between vacancies and unemployment[1]. Indeed, since the pandemic’s onset, several countries have observed movements in their Beveridge curves. Economists from Germany, Spain, the UK (Ando et al., 2022), Denmark (Darougheh, 2022) and Ireland (An Roinn Airgeadais, 2021) have reported outward shifts in their countries’ Beveridge curves. Particularly in the US, multiple researchers (Blanchard et al., 2022; Bok et al., 2022; Figura & Waller, 2022; Rodgers & Kassens, 2022) have identified a significant rightward Beveridgean shift since the pandemic hit. For central banks who are currently fighting surging prices, this is bad news. Their ability to engineer a soft landing in labour markets, whilst taming inflation, depends crucially on whether excess job vacancies can reduce without spiking unemployment.
This study aimed to investigate whether Singapore’s Beveridge curve has shifted since the Covid-19 pandemic hit. We find both graphical and empirical evidence of a rightward shift in the curve, as well as a steepening in its slope, since the second quarter of 2020. Additionally, we find that this Beveridgean shift was primarily driven by lower job matching efficiency and higher activity and partially by higher labour reallocation intensity.
The aims of this study were three-fold. The key objective was to understand and quantify the impact of the Covid-19 pandemic on the relationship between vacancies and unemployment in Singapore. A deeper understanding of Singapore’s Beveridge curve will aid in monetary policymaking as the Monetary Authority of Singapore tightens monetary policy to combat a 14-year high inflation. Secondly, analysing the drivers of the Beveridge curve shift has important policy implications for realigning current policy directions to mitigate the pandemic-induced structural changes in the labour market. Thirdly, this study focuses on Singapore because existing research on the vacancy-unemployment relationship is predominantly focused on Western economies such as the US and Europe with little work done in Asian countries. Singapore’s government is widely known to be highly efficient and successful in implementing economic growth policies; its workforce is also known to be highly-skilled and multicultural. In our view, this makes the country an interesting case study. To our knowledge, there has been no published research on Singapore’s Beveridge curve except Teo et. al’s (2005) fifteen years ago.
This paper is structured as follows: Section II provides a brief literature review, graphical and empirical analyses of the Singapore Beveridge curve shift, and the decomposition of the curve into its three shifters. Section III concludes the paper.
II. Singapore’s Bveridge Curve and its Post-Covid Shift
A. Brief literature review
The Beveridge curve is a graphical representation of the relationship between the unemployment and vacancy rates in the labour market. Named after the British economist, William Beveridge, who first described the relationship in the 1940s, it is a central regularity in labour economics across countries and time periods and at both aggregate and sectoral levels. Typically depicted as a downward-sloping convex curve (Diamond, 1982), the Beveridge curve reflects the inverse relationship between unemployment and vacancy rates. The location on the curve indicates labour market health, with economies traversing along the curve as they transition from recession to expansion. Shifts in the entire Beveridge curve are indicators of structural change in the efficiency of job-matching processes. These structural changes include shifts in labour force characteristics and compositions (Bonthuis et. al, 2016), matching technology (Bleakley & Fuhrer, 1997; Shimer, 2012), labour market institutions and policies (Nickell & Layard, 1999), and unemployment hysteresis (Bova et al., 2018).
In this study, we employed two methods, namely graphical examination and empirical analysis, to investigate the impact of the Covid-19 pandemic on Singapore’s Beveridge curve. All the data were obtained from the Singapore Ministry of Manpower website[2].
B. Graphical examination
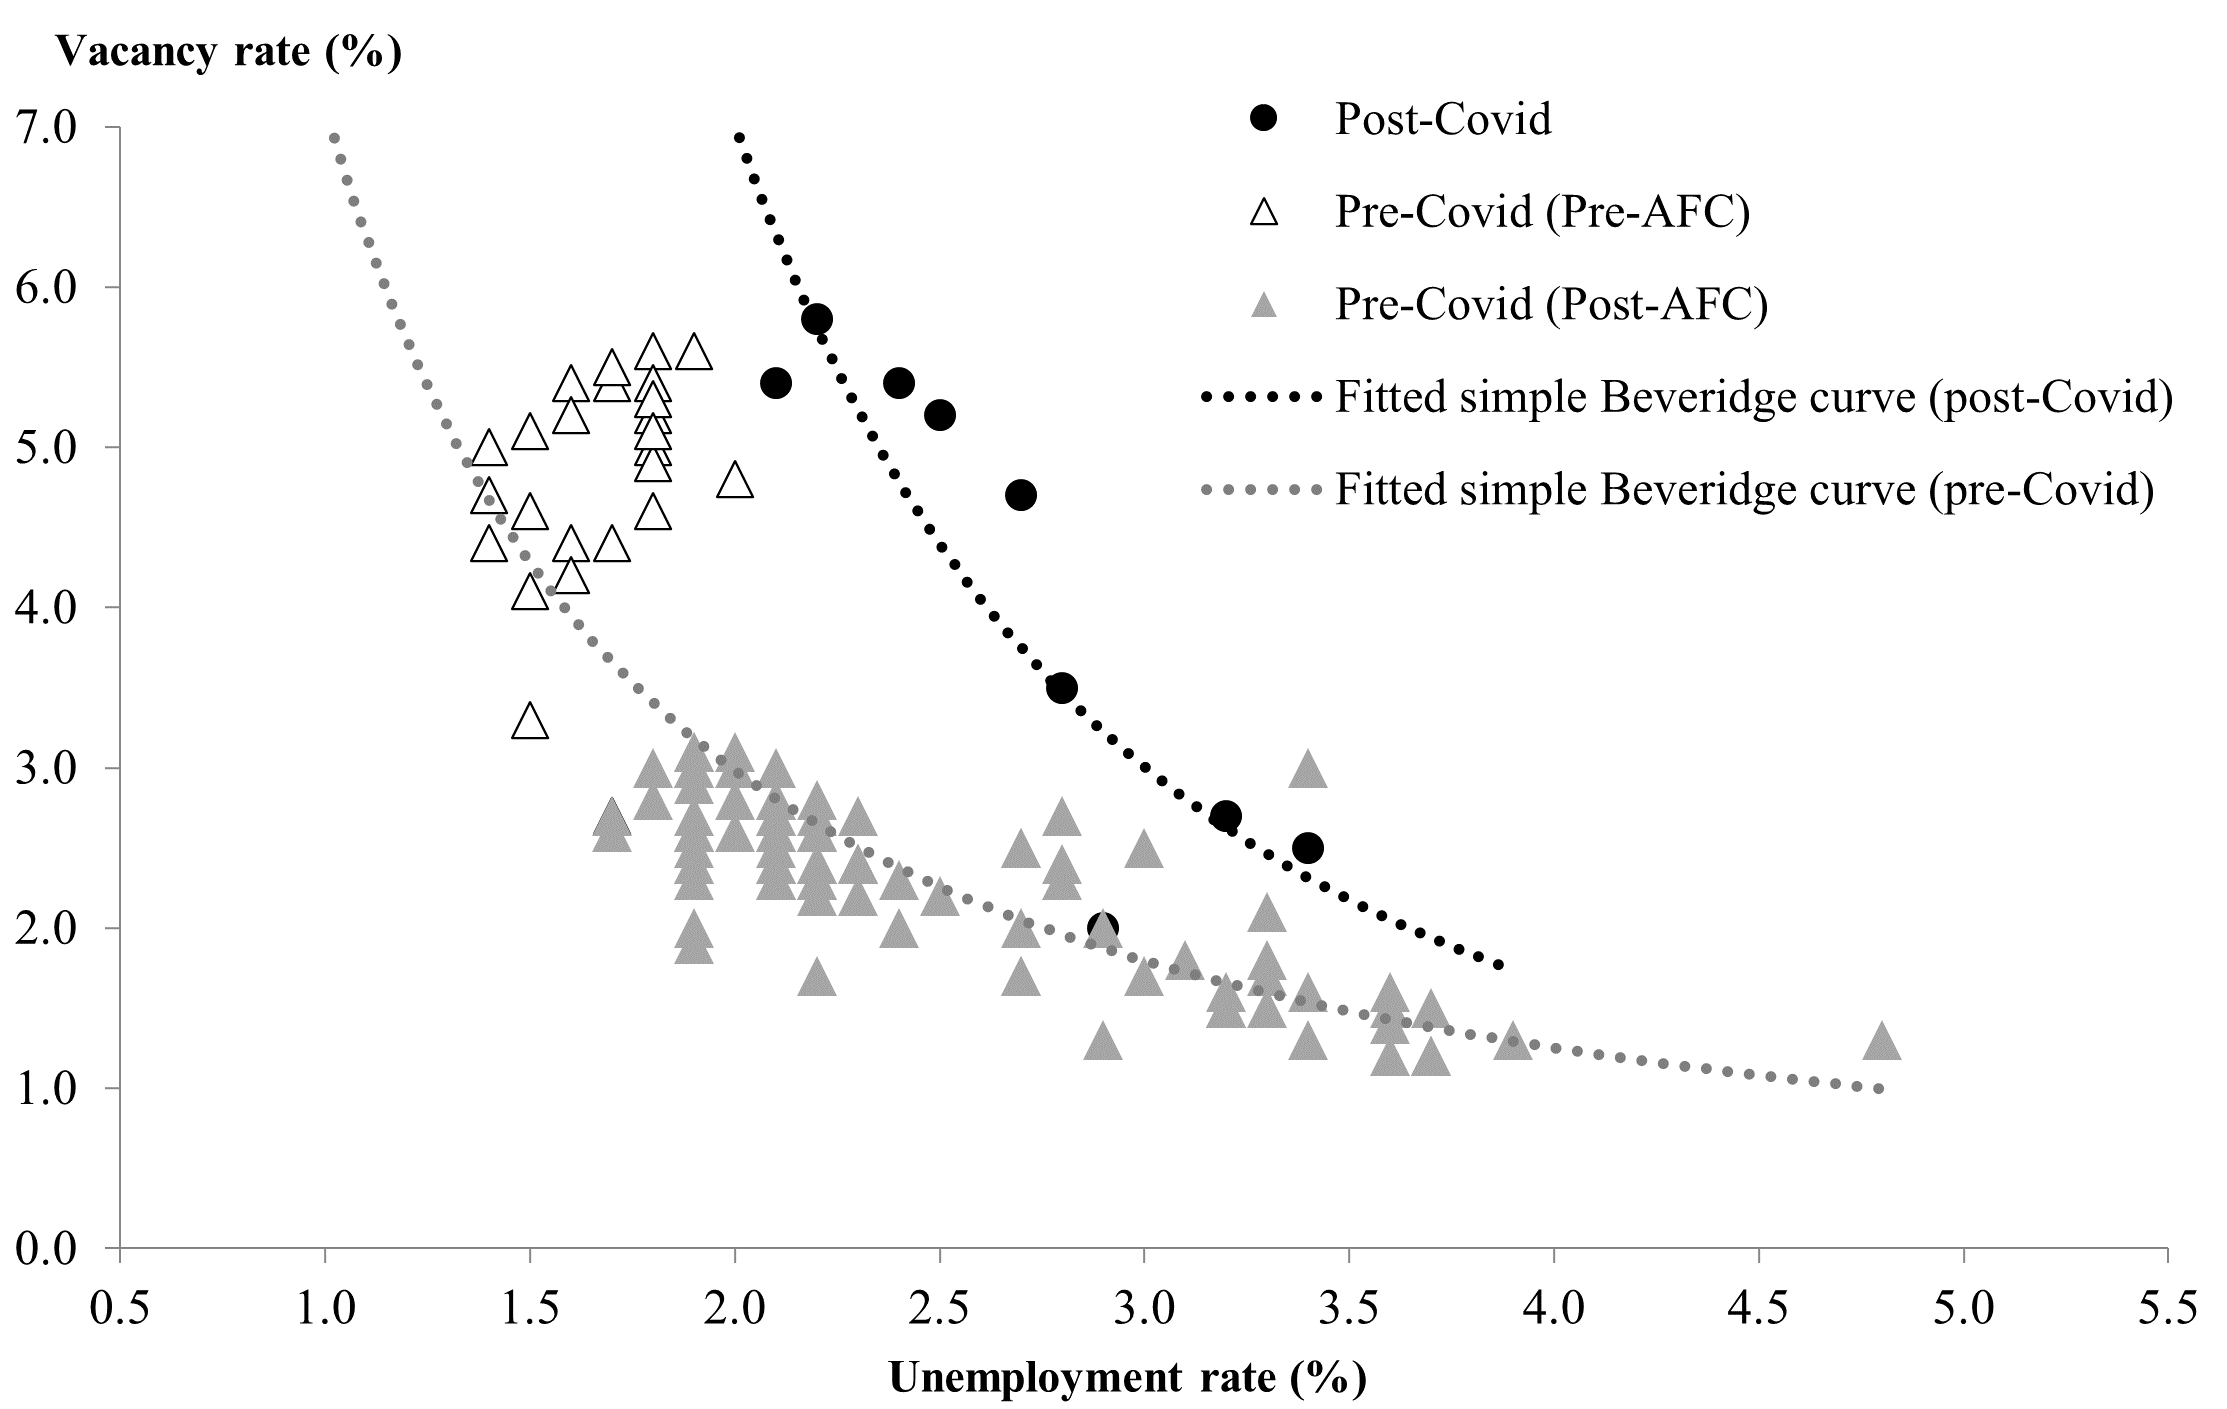
We first constructed the Beveridge curve of Singapore using quarterly data from the Labour Market Report spanning Q1 1992 to Q2 2022. Figure 1 shows each data point as a combination of the job vacancy and unemployment rates, with separate curves fitted for the pre-Covid period (Q1 1992 to Q1 2020) and post-Covid period (Q2 2020 to Q2 2022). The pre-Covid period can be further divided into two phases: pre-Asian financial crisis and post-Asian financial crisis.
In this first phase of Q1 1992 to Q1 1998, before the Asian Financial Crisis (AFC) hit, the Singaporean economy mostly resided at the top part of the fitted Beveridge curve, reflecting a time of high job vacancy rates and low unemployment levels. When the AFC hit, the job vacancy rate gradually declined while the unemployment rate increased. At its worst, in the fourth quarter of 1998, the job vacancy rate dropped to 1.3% and the unemployment rate peaked at 3.4%. Simultaneously, the economy started traversing to the bottom half of the Beveridge curve, where job vacancy rates largely stayed within 1% to 3%, and the unemployment rate occupied a wider range of 1.5% to 4%. The economy’s movement mostly along the fitted Beveridge curve reflects that job matching efficiency has stayed fairly constant over the period Q2 1998 to Q1 2020.
After the Covid pandemic struck in the second quarter of 2020, there was a clear outward shift in the newly-fitted Beveridge curve and a steepening of the curve’s slope, suggesting that the matching efficiency of the labour market has worsened and the unemployment rate currently decreases as vacancy rate increases. In a recent biannual survey by a human resource consultant, Randstad[3], it was revealed that the Singaporean workforce’s sentiments and perceptions of employment have changed since the pandemic. According to the survey, “94% of [Singaporeans] maintained that post-pandemic work-life balance is [now] important to them. [However while] 77% of respondents in the study said that flexibility in working location is important [to them], only 52% reported that their employers provided them remote working options. Likewise, 4 in 5 of [the] survey respondents value flexible working hours, but only 60% of them reported being given this autonomy by their employers.” The results of the survey clearly point to an increased mismatch between the demand and supply of labour in Singapore after the Covid pandemic.

C. Empirical analysis
We performed a rigorous empirical analysis to establish the statistical significance of the Beveridge curve. We adopted a Beveridge specification used by Valetta (2005), the European Commission (2011) and Bonthuis et al. (2013) that regresses the unemployment rate Ut against the job vacancy rate Vt and some shift parameters:
Ut=α+β1+β2Vt+β3V2t+β4COVIDt+β5COVIDt∗Vt+εtUt−1
where Ut-1 is the unemployment rate lagged by one period, Vt is the job vacancy rate and the subscript t represents the time. The quadratic term V2t is included to ensure the convexity of the Beveridge curve and therefore captures non-linearities in the Beveridge relationship. The dummy variable COVIDt takes the value of 1 during the pandemic period of Q2 2020 - Q2 2022, and takes the value of 0 otherwise. In addition, the dummy variable COVIDt*Vt represents an interaction between the COVID dummy and the vacancy rate variable, and captures changes in the slope of the Beveridge curve.
Table 1 shows the results of our regressions. The coefficient for the lagged unemployment variable is large and significant, implying a high level of persistence in unemployment. The coefficients for the job vacancy rate and its quadratic term are both negative and positive respectively and highly statistically significant, confirming that the Beveridge curve for Singapore is downward sloping and convex. More importantly, the coefficient for the Covid dummy variable is positive and significant, suggesting that there has been a rightward shift in the Beveridge curve since the onset of the pandemic. Based on our regression, the unemployment rate is now 0.805% higher than that recorded before the pandemic for any vacancy rate. Additionally, the positive coefficient of the interaction term shows that the slope of the curve has steepened. This reflects an overall decline in the responsiveness of unemployment to vacancy developments, with a 1% change in the vacancy rate now yielding an unemployment rate response that is weaker by -0.116% compared to that recorded before the pandemic. Our findings therefore tally with the findings from our graphical analysis.
D. Decomposing into three shifters
To delve further into the drivers of the outward shift in Singapore’s Beveridge curve, we employed the framework used by Blanchard, Domash & Summers (2022) to decompose the Beveridge curve movements into curves caused by aggregate activity, matching efficiency and reallocation. We first expressed the relations between gross hires, unemployment and vacancies as a Cobb-Douglas function with constant returns to scale:
H=aUαV1−α
where H is the number of gross hires, V is the number of vacancies and U is the number unemployed. In this equation, a therefore represents the matching efficiency.
Dividing both sides by the labour force N,
HN=a(UN)α(VN)1−α
Then,
h=auαv1−α
where h is the hiring rate (or labour reallocation intensity), u is the unemployment rate and v is the job vacancy rate.
Equation (4) yields a downward-sloping convex Beveridgean relationship between the unemployment rate u and the vacancy rate v, with the position of the curve dependent on the parameters α, a and h. An increase in h or a decline in a shifts the Beveridge curve up, while stronger activity rotates the activity line to the left.
We constructed a time series for each of the three shifters. First, we plotted the shifts in activity using movements in v/u as the proxy. According to Panel A in Figure 2, at the onset of the pandemic, there was a brief dip in activity for one quarter before the economy staged a strong recovery that surpassed previous peaks to reach the current historical high level. This very high ratio of vacancies to unemployment reflects a very strong activity level and a potential overheating of the labour market that can raise wages.
To calculate the labour market matching efficiency, we first estimated the value of α by regressing the log of hires on the log of unemployment and the log of vacancies (both lagged by one period). Our regression gives us an estimated value of 0.52, which is close to the range of estimates of 0.3 to 0.5 found in economic literature. The matching efficiency a is then calculated as
a=h(uαv1−α)
Figure 2 shows the time series plot of a. While there was a massive decline in matching efficiency when the pandemic hit, unlike the activity shifter, the recovery was more prolonged. It took the labour market seven quarters before it got back to its pre-pandemic matching efficiency level, which is still below the long-term average. Although job matching efficiency had been declining before Covid hit, the subsequent change in employee’s preference for flexible working arrangements post-Covid and the inadequate employer accommodation will most likely exacerbate the pre-existing trend and keep matching efficiency structurally lower compared to the past.
Finally, we graphed the shifts in labour reallocation, which are indicated by the movements in h. This is shown in Figure 4 where we observe the same initial collapse in labour reallocation intensity at the onset of the pandemic. The hiring rate however rebounded strongly after that to exceed both its pre-pandemic level as well as its long-term average.
Our study of the three drivers of unemployment-vacancy movements therefore shows that the outward shift in Singapore’s Beveridge curve is driven mostly by higher activity and lower matching efficiency and partially by higher labour reallocation intensity.

III. Conclusions
The Covid-19 pandemic over the last two years has had a massive economic and societal impact on the global economy. As companies adopted remote working and flexible working arrangements to meet the challenges of the pandemic, it inadvertently changed the way people perceive work, and the Beveridgean relationship between vacancies and unemployment.
We found graphical and empirical evidence for an outward shift in Singapore’s Beveridge curve since the pandemic as well as a steepening of the curve’s slope. This suggests a deterioration in the labour market matching efficiency and warns of a decline in the responsiveness of unemployment to changes in vacancies compared to the past. Our decomposition of the Beveridge curve shift into three components shows that much of the shift has been primarily driven by higher activity and lower matching efficiency, with higher labour reallocation being a partial contributor. This has important economic implications for Singapore, and developing the right policies can help mitigate some of the challenges. Specifically, improving the labour market matching efficiency is critical. This can be achieved by developing job search tools, providing continuous education and training, implementing job matching programs, and encouraging firms to adapt to a new hybrid working environment. Improving Singapore’s institutional quality, such as promoting economic diversification, enhancing public sector governance, and encouraging greater social cohesion, can also create a favourable investment climate that attracts investment and creates jobs. By implementing the right policies, Singapore’s Beveridge curve will be better placed to recover from its long Covid shifts.